
















©The Author(s) 2026.
World J Diabetes. Feb 15, 2026; 17(2): 112475
Published online Feb 15, 2026. doi: 10.4239/wjd.v17.i2.112475
Published online Feb 15, 2026. doi: 10.4239/wjd.v17.i2.112475
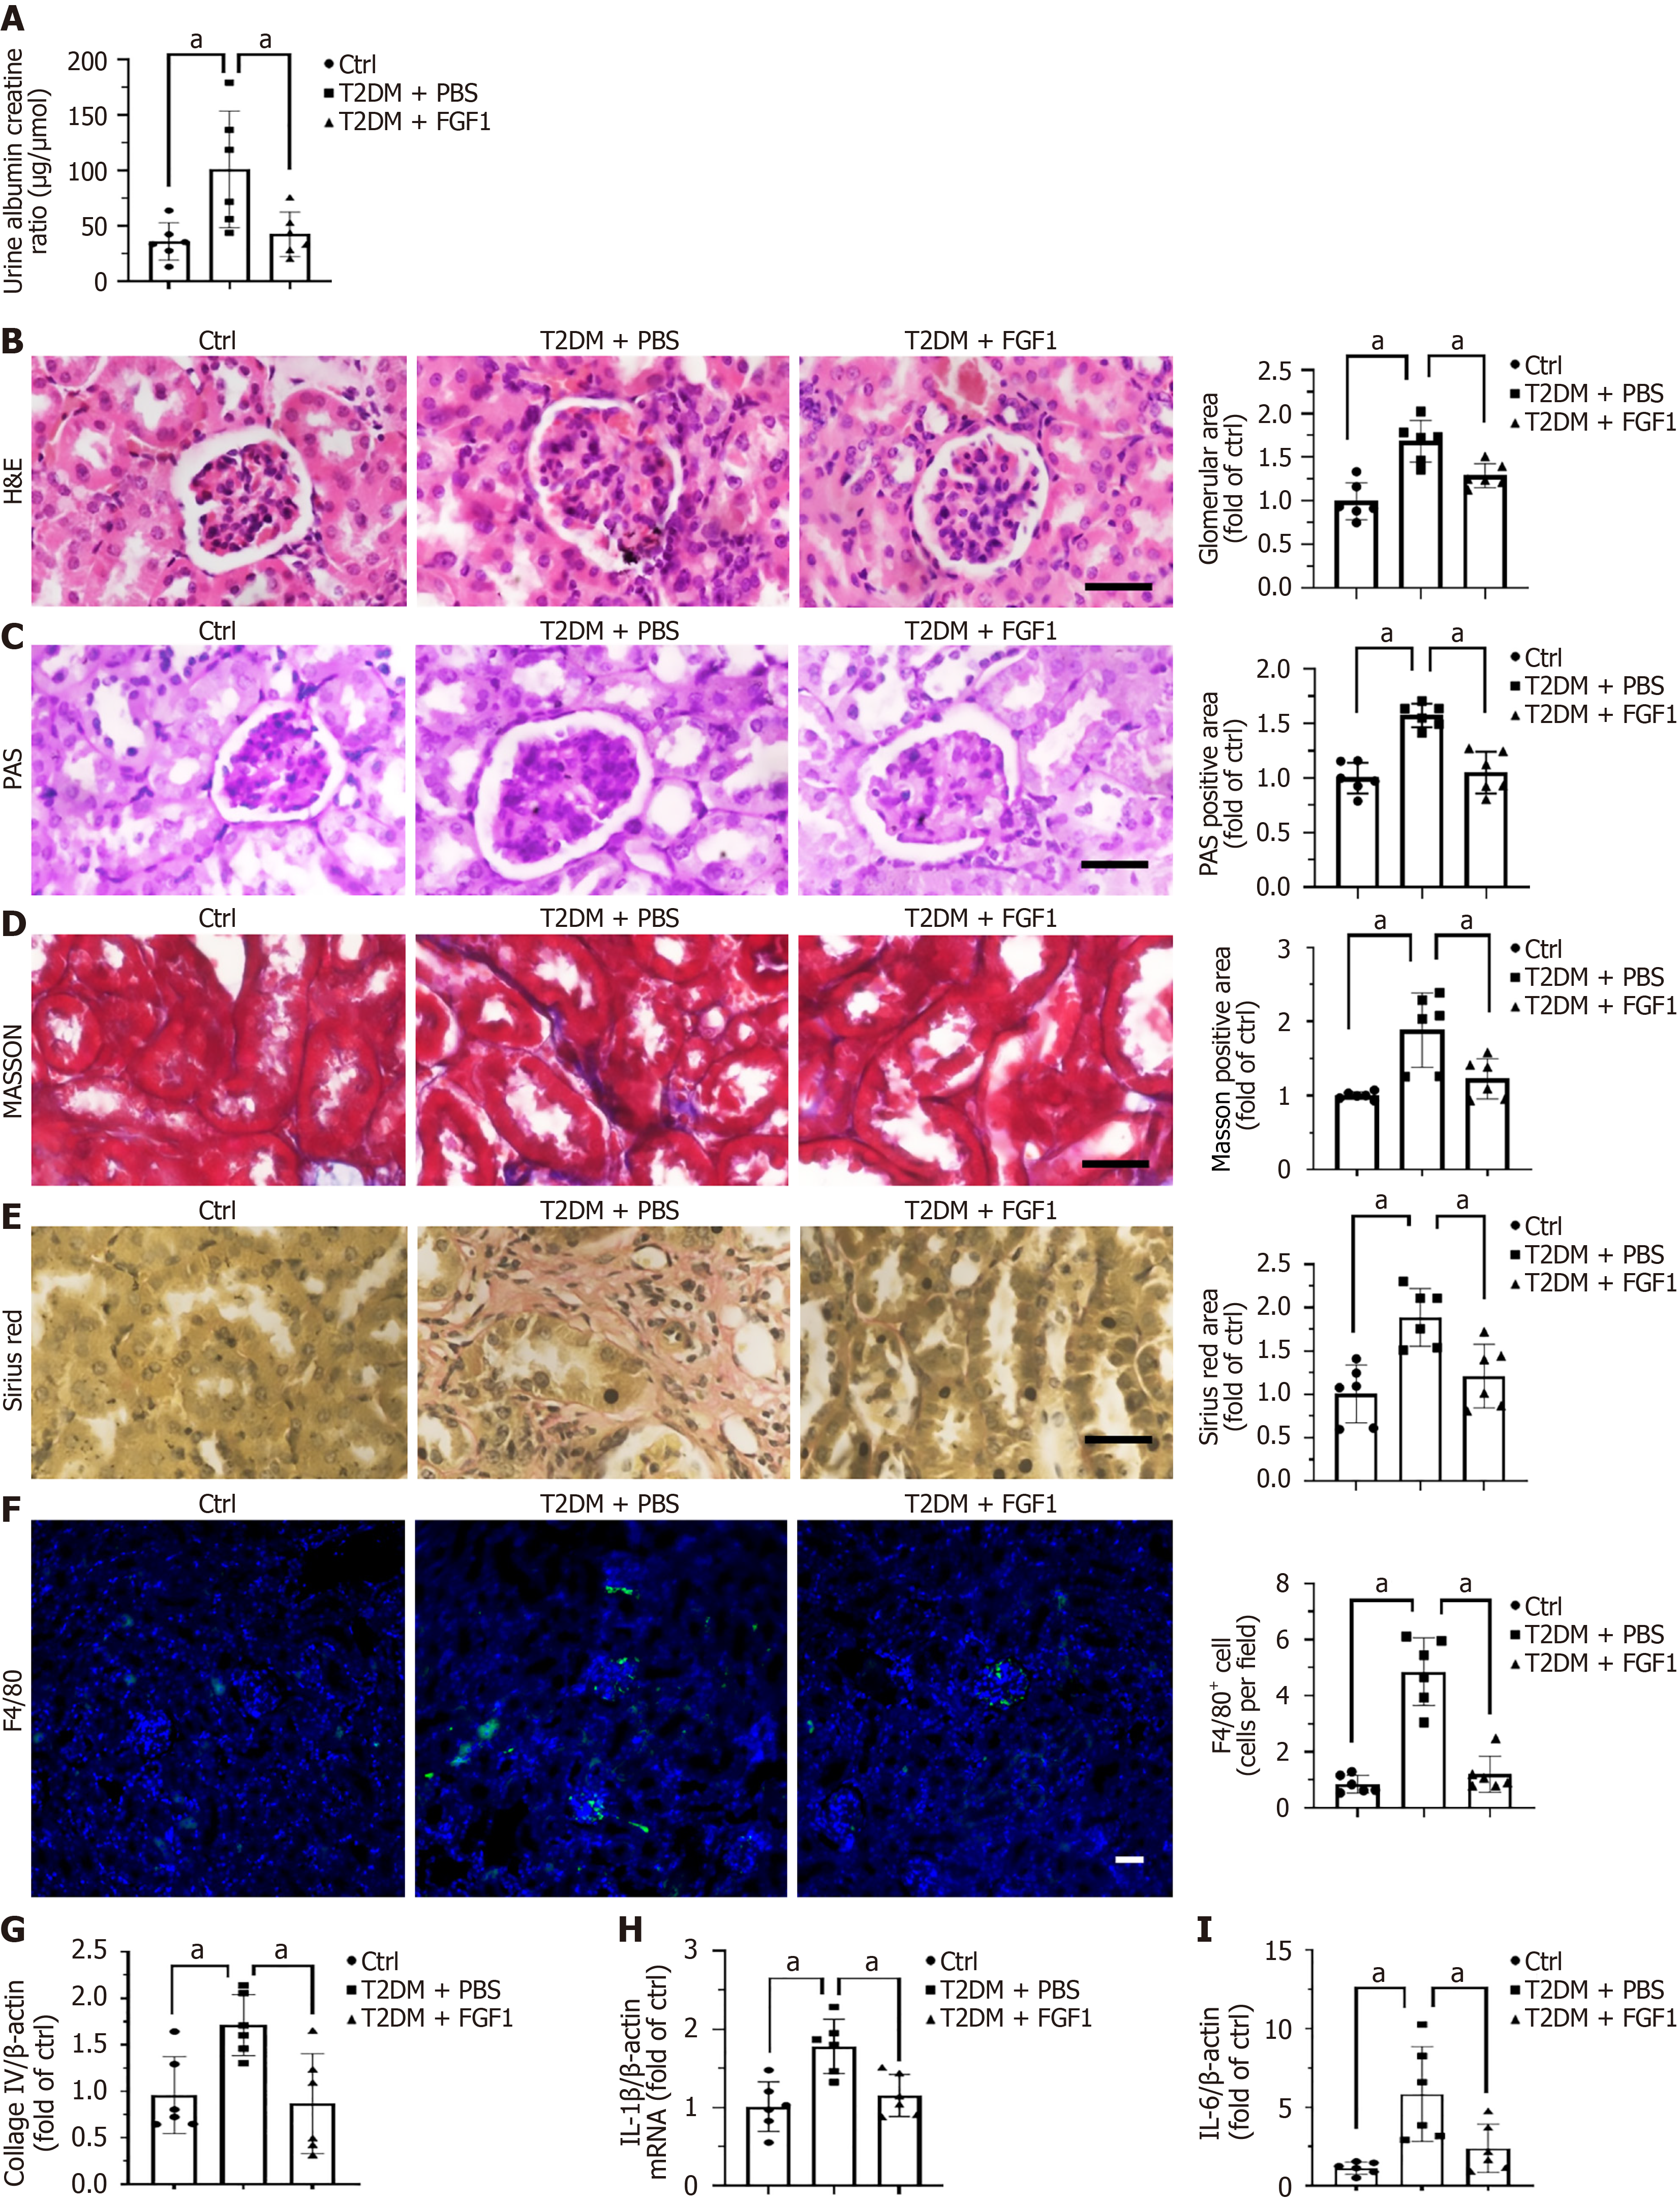
Figure 2 Fibroblast growth factor 1 ameliorates diabetes-induced renal dysfunction and histopathological alterations.
A: Urinary albumin-to-creatinine ratio for assessing renal function; B: Representative images of hematoxylin and eosin staining of kidney tissue and quantification of glomerular sizes based on hematoxylin and eosin staining; C: Periodic acid-Schiff staining and quantification of Periodic acid-Schiff positive staining area; D: Masson trichrome staining and quantification of Masson positive staining area; E: Sirius Red staining and quantification of Sirius Red positive staining area; F: F4/80 immunofluorescence staining and quantification of F4/80 positive macrophage; G-I: The mRNA expression levels of collagen IV, interleukin-1β, and interleukin-6 analyzed by RT-qPCR. Data were presented as mean ± SD. aP < 0.05. n = 6 mice per group. Bar = 200 μm. Ctrl: Control; FGF1: Fibroblast growth factor 1; HE: Hematoxylin and eosin; IL: Interleukin; PAS: Periodic acid-Schiff; T2DM: Type 2 diabetes mellitus.
- Citation: Li YJ, Ge HY, Zhang GG, Chen HY, Xi YJ, Wang K, Huang YL, Zhang C, Fan X, Yan XQ. Fibroblast growth factor 1 alleviates diabetic nephropathy by reducing renal lipid accumulation in diabetic kidney. World J Diabetes 2026; 17(2): 112475
- URL: https://www.wjgnet.com/1948-9358/full/v17/i2/112475.htm
- DOI: https://dx.doi.org/10.4239/wjd.v17.i2.112475