
















©The Author(s) 2026.
World J Diabetes. Feb 15, 2026; 17(2): 111453
Published online Feb 15, 2026. doi: 10.4239/wjd.v17.i2.111453
Published online Feb 15, 2026. doi: 10.4239/wjd.v17.i2.111453
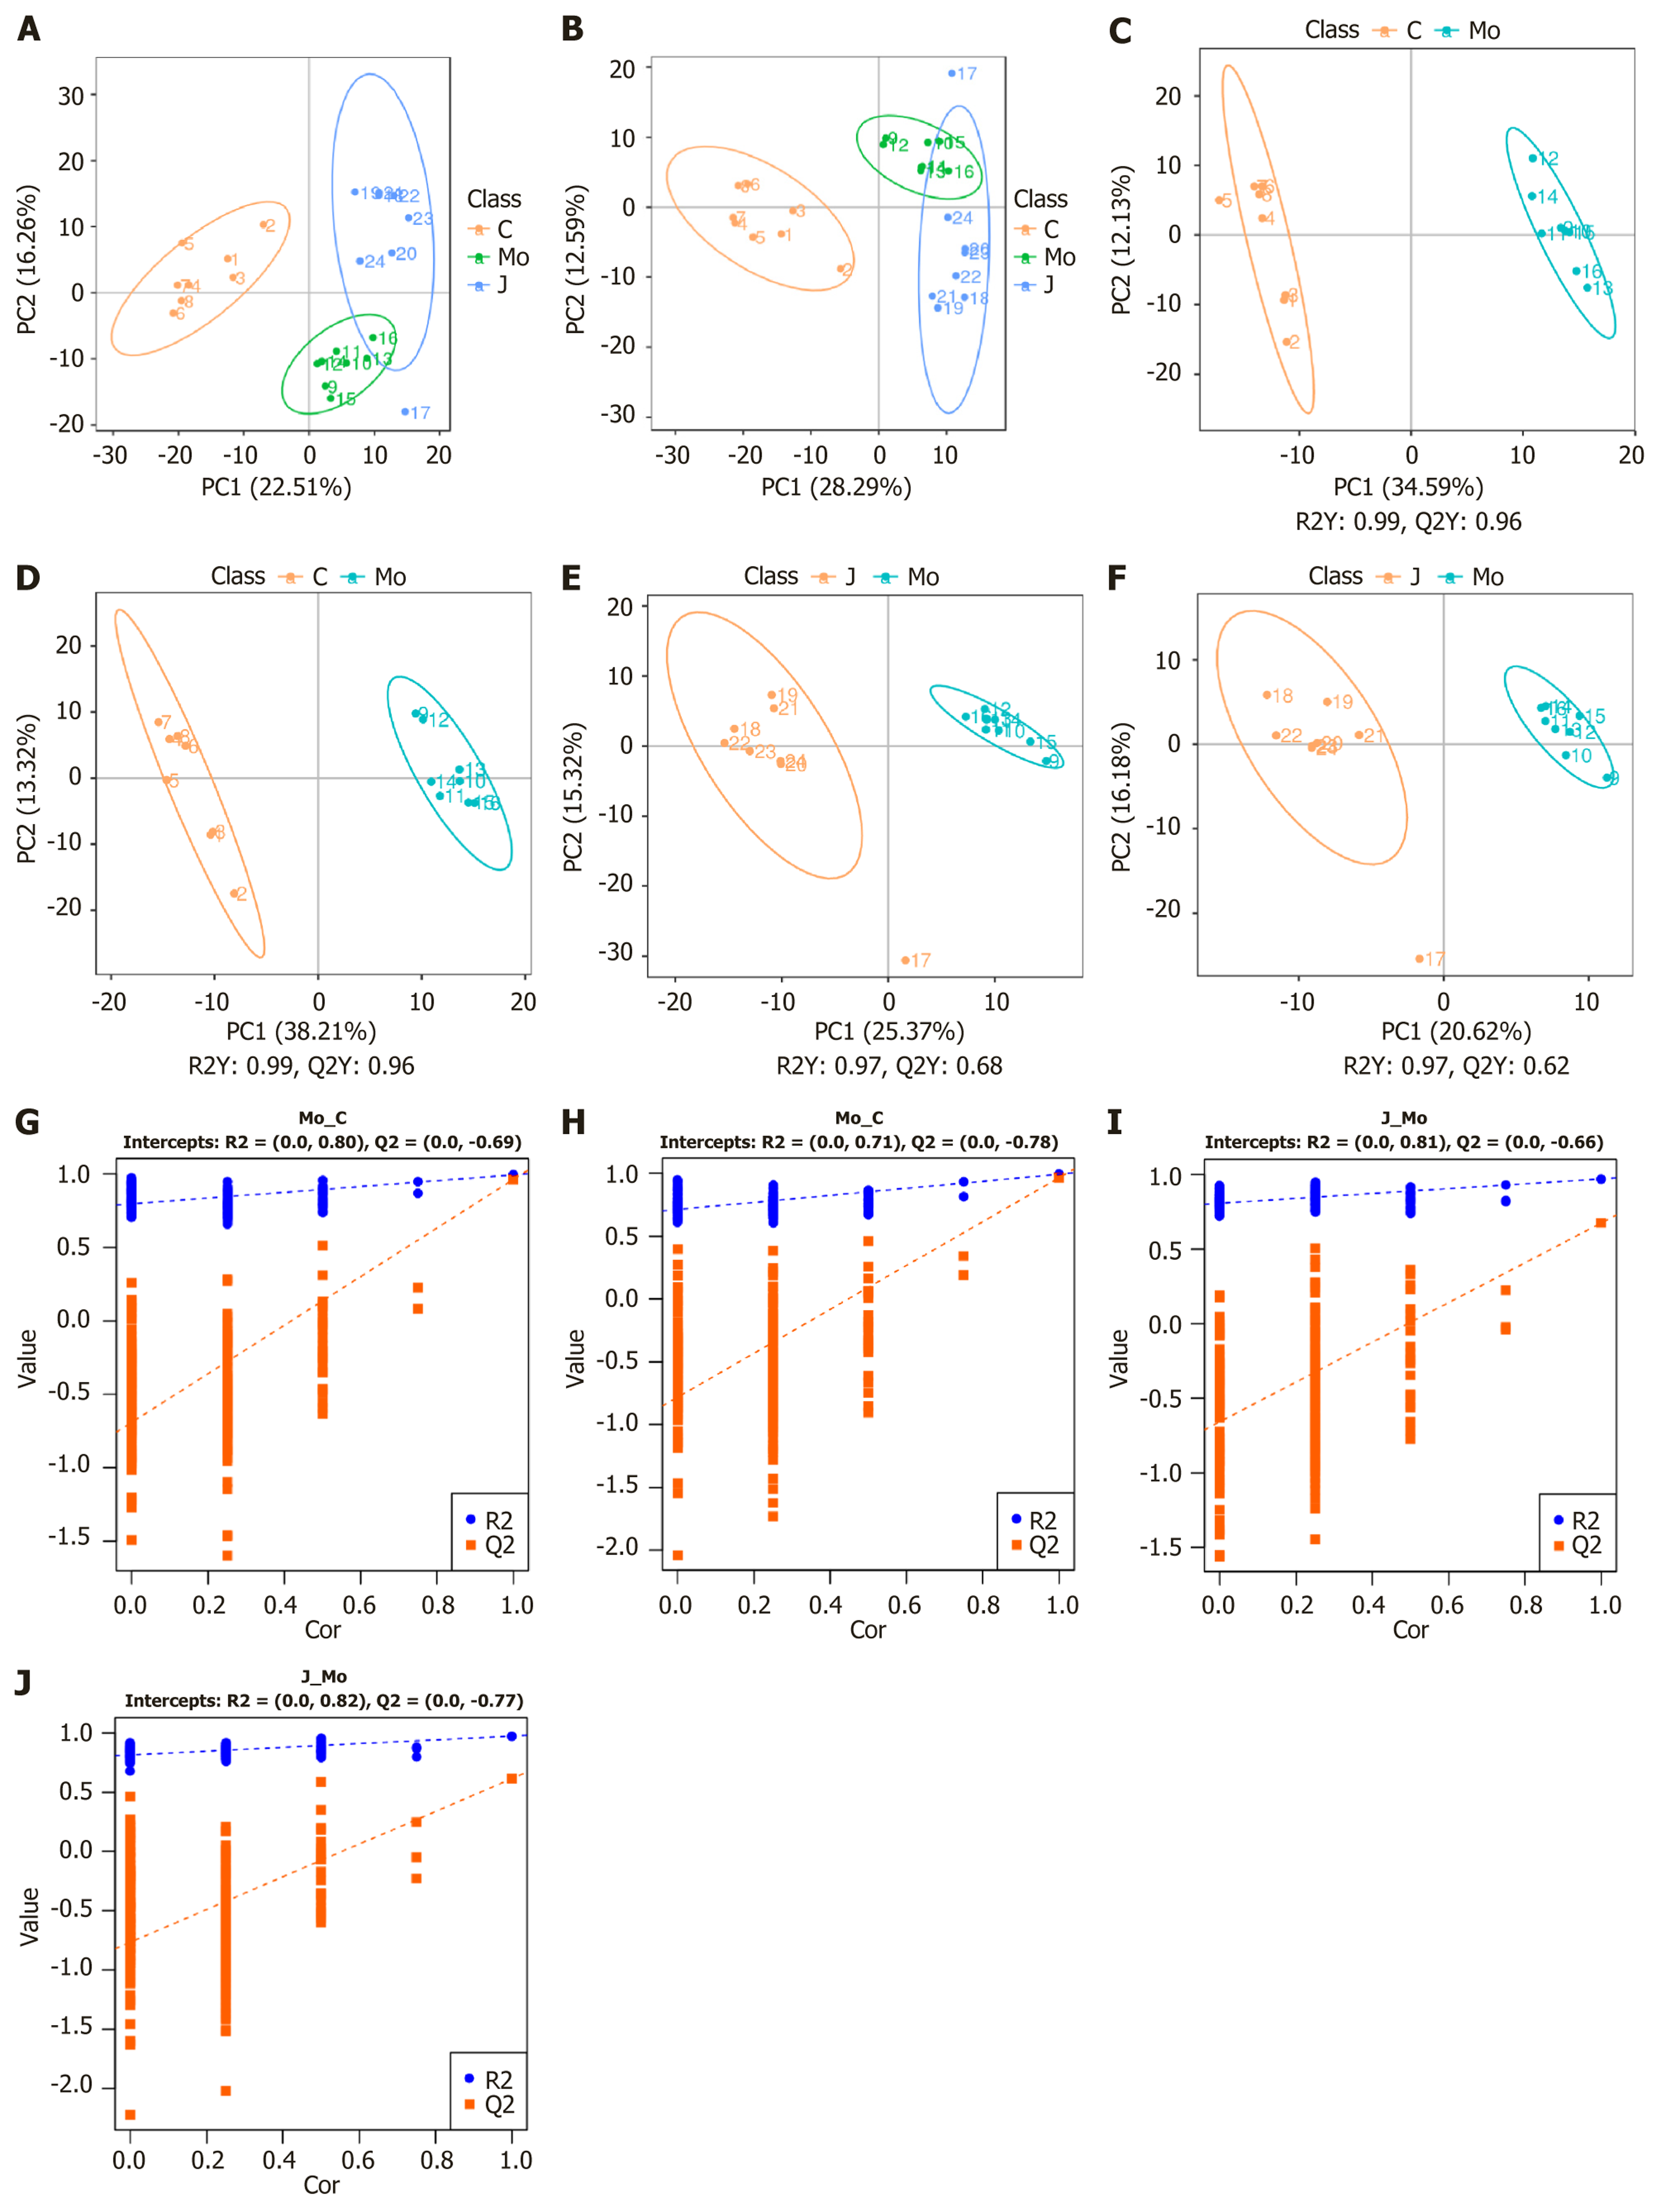
Figure 4 Multivariate statistical analysis of liver samples among the control, model, and Jiangtang Tiaozhi formula groups.
A: Principal components analysis (PCA) score plot of liver samples among control, model, and Jiangtang Tiaozhi formula (JTTZF) groups in the positive ion mode; B: PCA score plot of liver samples among control, model, and JTTZF groups in the negative ion mode; C: Scores plots of partial least squares discriminant analysis (PLS-DA) between control and model groups in the positive ion mode; D: Scores plots of PLS-DA between control and model groups in the negative ion mode; E: Scores plots of PLS-DA between and between model and JTTZF groups in the positive ion mode; F: Scores plots of PLS-DA between model and JTTZF groups in the negative ion mode; G: Permutation tests of PLD-DA models between control and model groups in the positive ion mode; H: Permutation tests of PLD-DA models between control and model groups in the negative ion mode; I: Permutation tests of PLD-DA models between model and JTTZF groups in the positive ion mode; J: Permutation tests of PLD-DA models between model and JTTZF groups in the negative ion mode. PC: Principal component; J: Jiangtang Tiaozhi formula group; Mo: Model group; C: Control group; Cor: Correlation.
- Citation: Tian JX, Zhang YJ, Zhang YX, Wei JH, Fang XY, Miao RY, Ma KL, Guan HF, Wang XM, Wu HR. Integrated hepatic transcriptome and metabolome reveal the mechanisms of Jiangtang Tiaozhi formula on improving glycolipid metabolic disorder. World J Diabetes 2026; 17(2): 111453
- URL: https://www.wjgnet.com/1948-9358/full/v17/i2/111453.htm
- DOI: https://dx.doi.org/10.4239/wjd.v17.i2.111453