















Copyright: ©Author(s) 2026.
World J Diabetes. Oct 15, 2026; 17(10): 124271
Published online Oct 15, 2026. doi: 10.4239/wjd.124271
Published online Oct 15, 2026. doi: 10.4239/wjd.124271
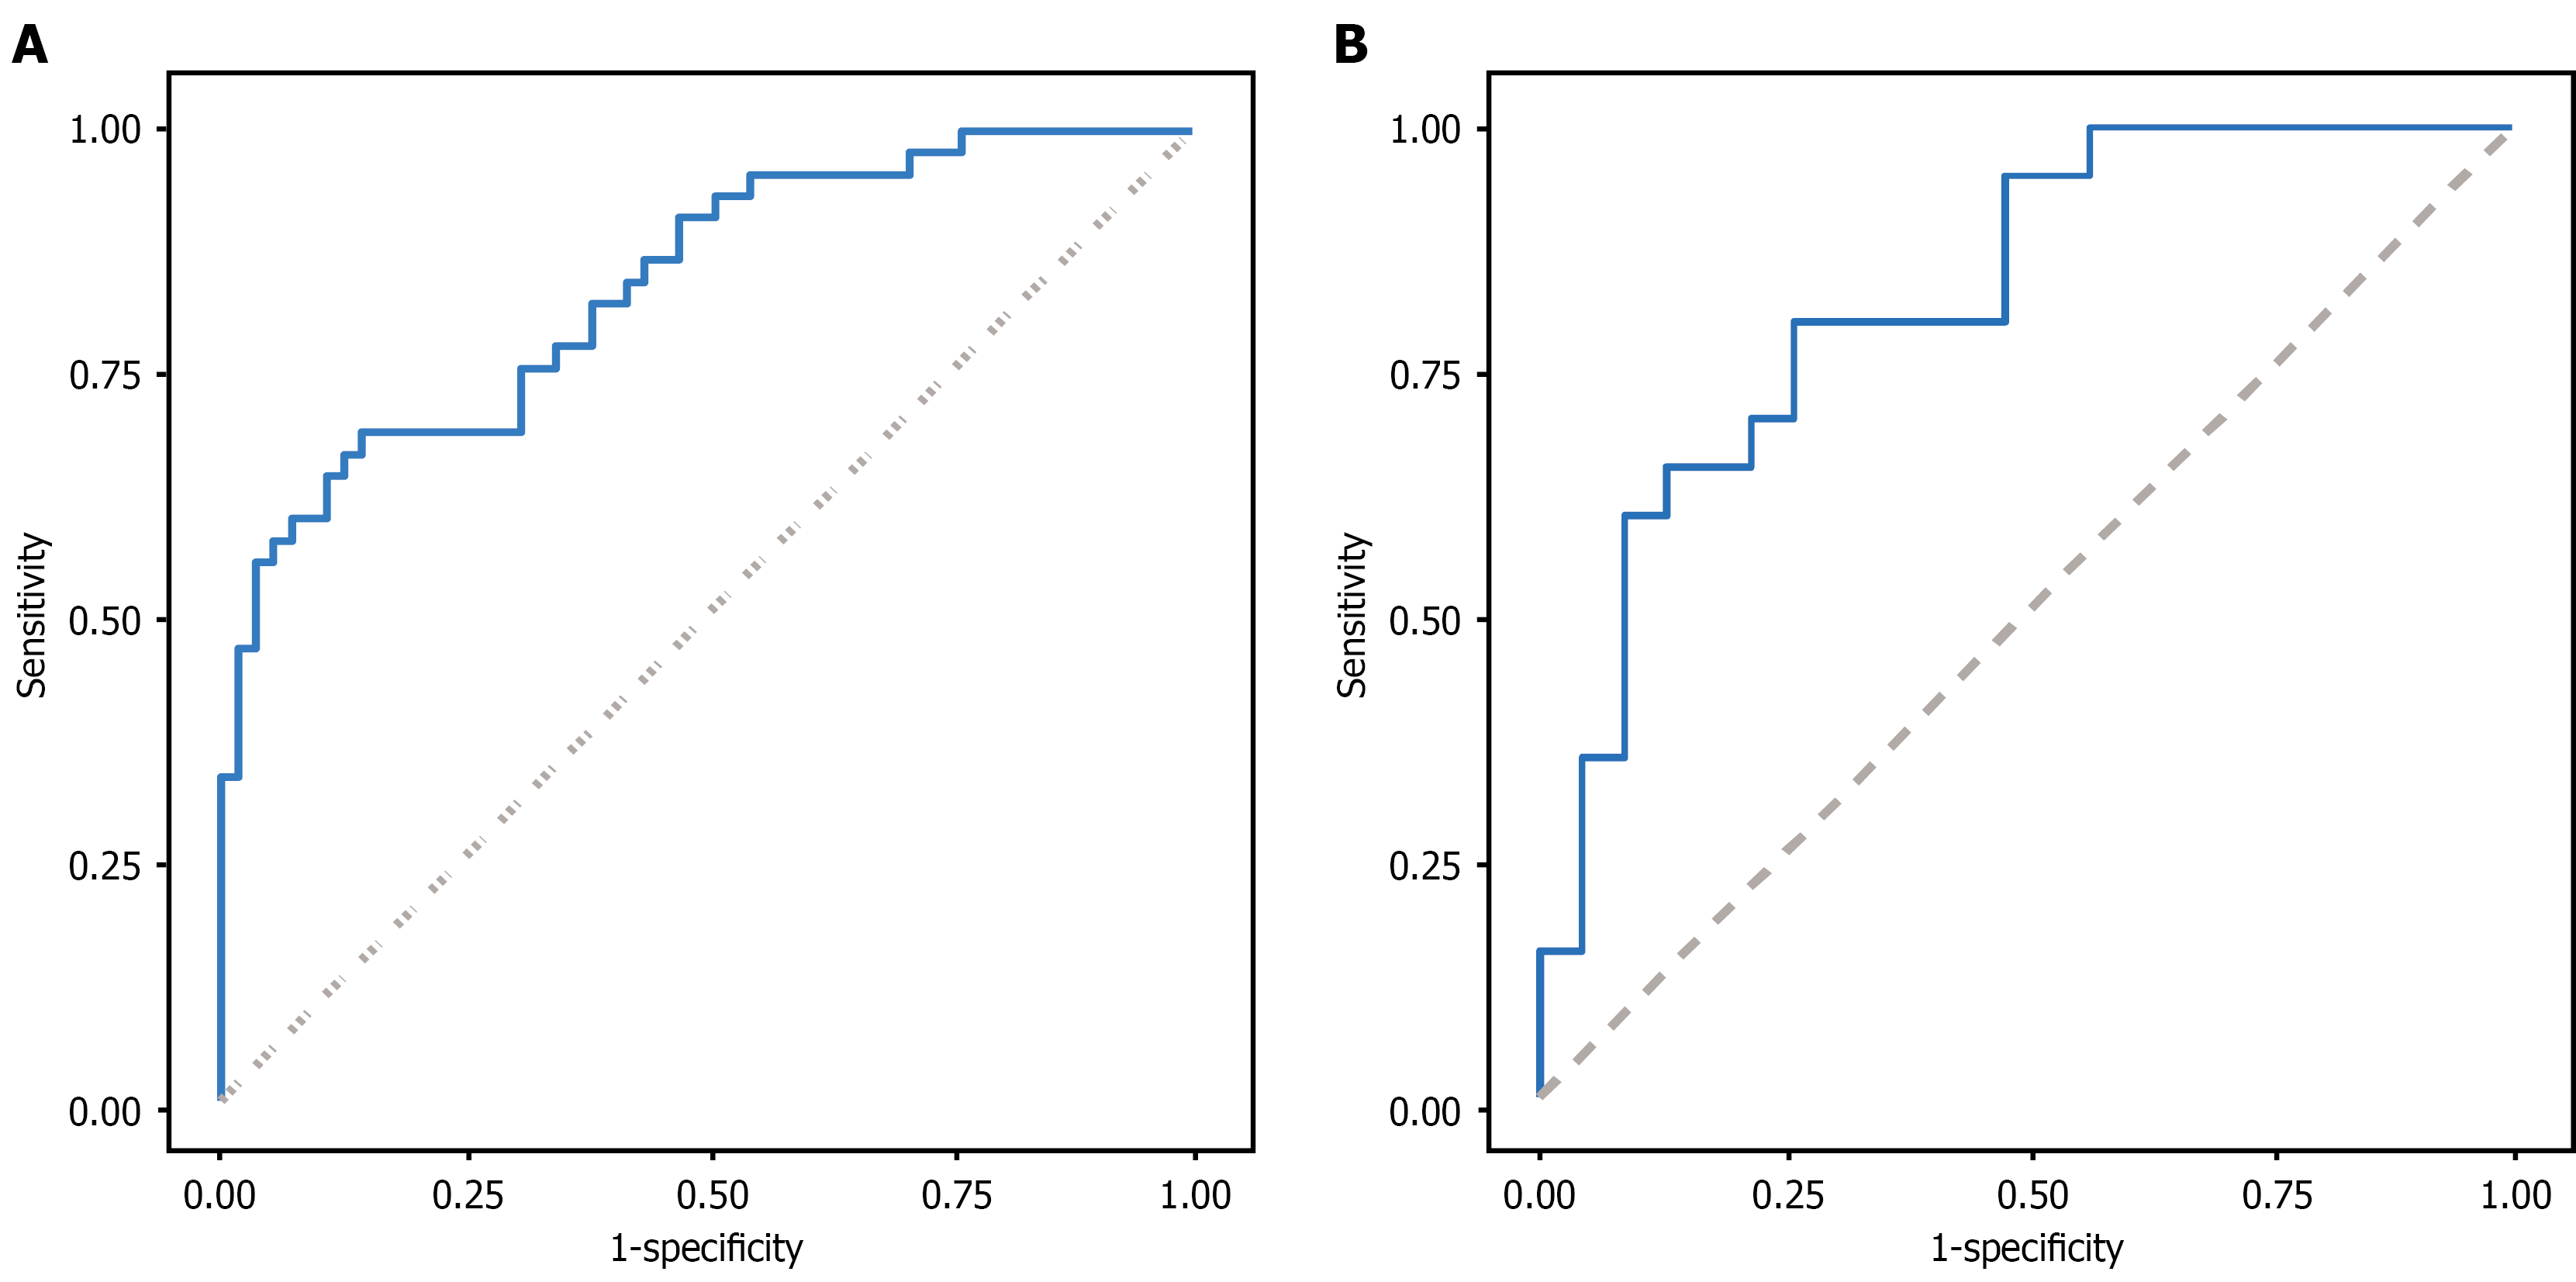
Figure 4 Receiver operating characteristic curve analysis of the prediction model.
A: Training cohort; B: Validation cohort. In the training cohort, the area under the curve was 0.839 (95% confidence interval: 0.762-0.916). In the validation cohort, the area under the curve was 0.826 (95% confidence interval: 0.703-0.950).
- Citation: Hu D, Lin XY, Zhao TQ, Ji H, Chen MW, Zhao XT. Clinical significance of serum thrombospondin-4 for interventional restenosis in diabetes patients complicated by lower extremity arteriosclerosis obliterans. World J Diabetes 2026; 17(10): 124271
- URL: https://www.wjgnet.com/1948-9358/full/v17/i10/124271.htm
- DOI: https://dx.doi.org/10.4239/wjd.124271