
















Copyright: ©Author(s) 2026.
World J Diabetes. Oct 15, 2026; 17(10): 124186
Published online Oct 15, 2026. doi: 10.4239/wjd.124186
Published online Oct 15, 2026. doi: 10.4239/wjd.124186
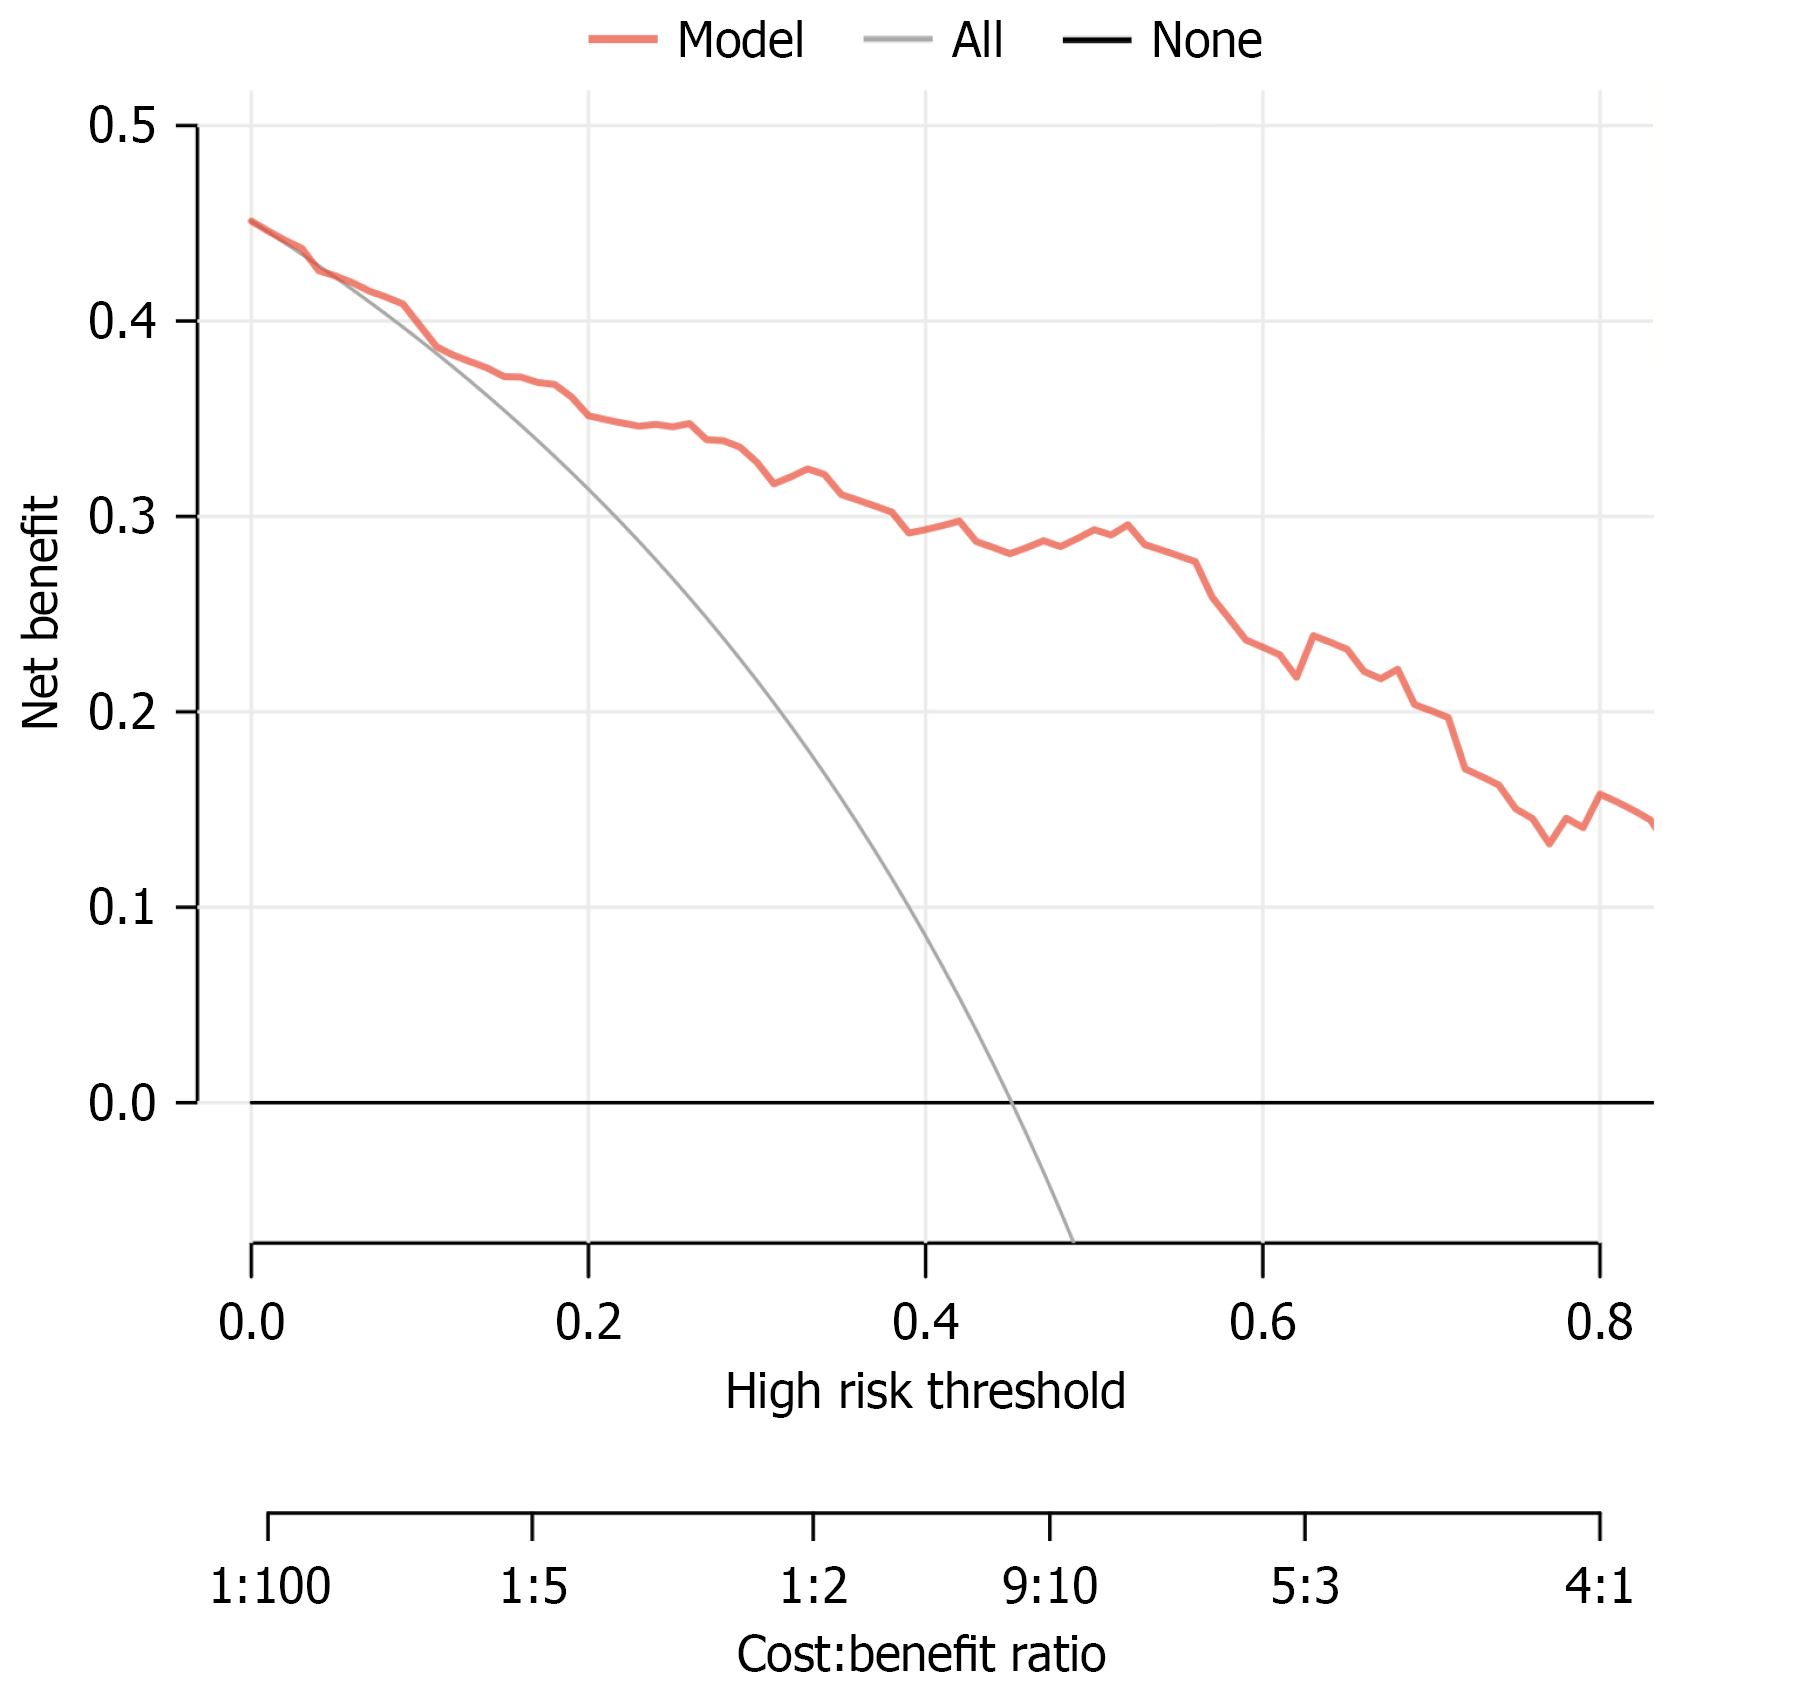
Figure 7 Decision curve analysis of nomogram prediction models.
The X-axis shows the threshold probability, and the Y-axis is the net benefit. The red line indicates that no patients progress to severity, and the black line indicates that all patients progress to severity.
- Citation: Chai M, Zhao LX, Wang ZG, Xu DH. Hypertriglyceridemic acute pancreatitis with diabetes mellitus: Investigation of factors and predictive models for severity progression. World J Diabetes 2026; 17(10): 124186
- URL: https://www.wjgnet.com/1948-9358/full/v17/i10/124186.htm
- DOI: https://dx.doi.org/10.4239/wjd.124186