
















Copyright: ©Author(s) 2026.
World J Diabetes. Oct 15, 2026; 17(10): 124186
Published online Oct 15, 2026. doi: 10.4239/wjd.124186
Published online Oct 15, 2026. doi: 10.4239/wjd.124186
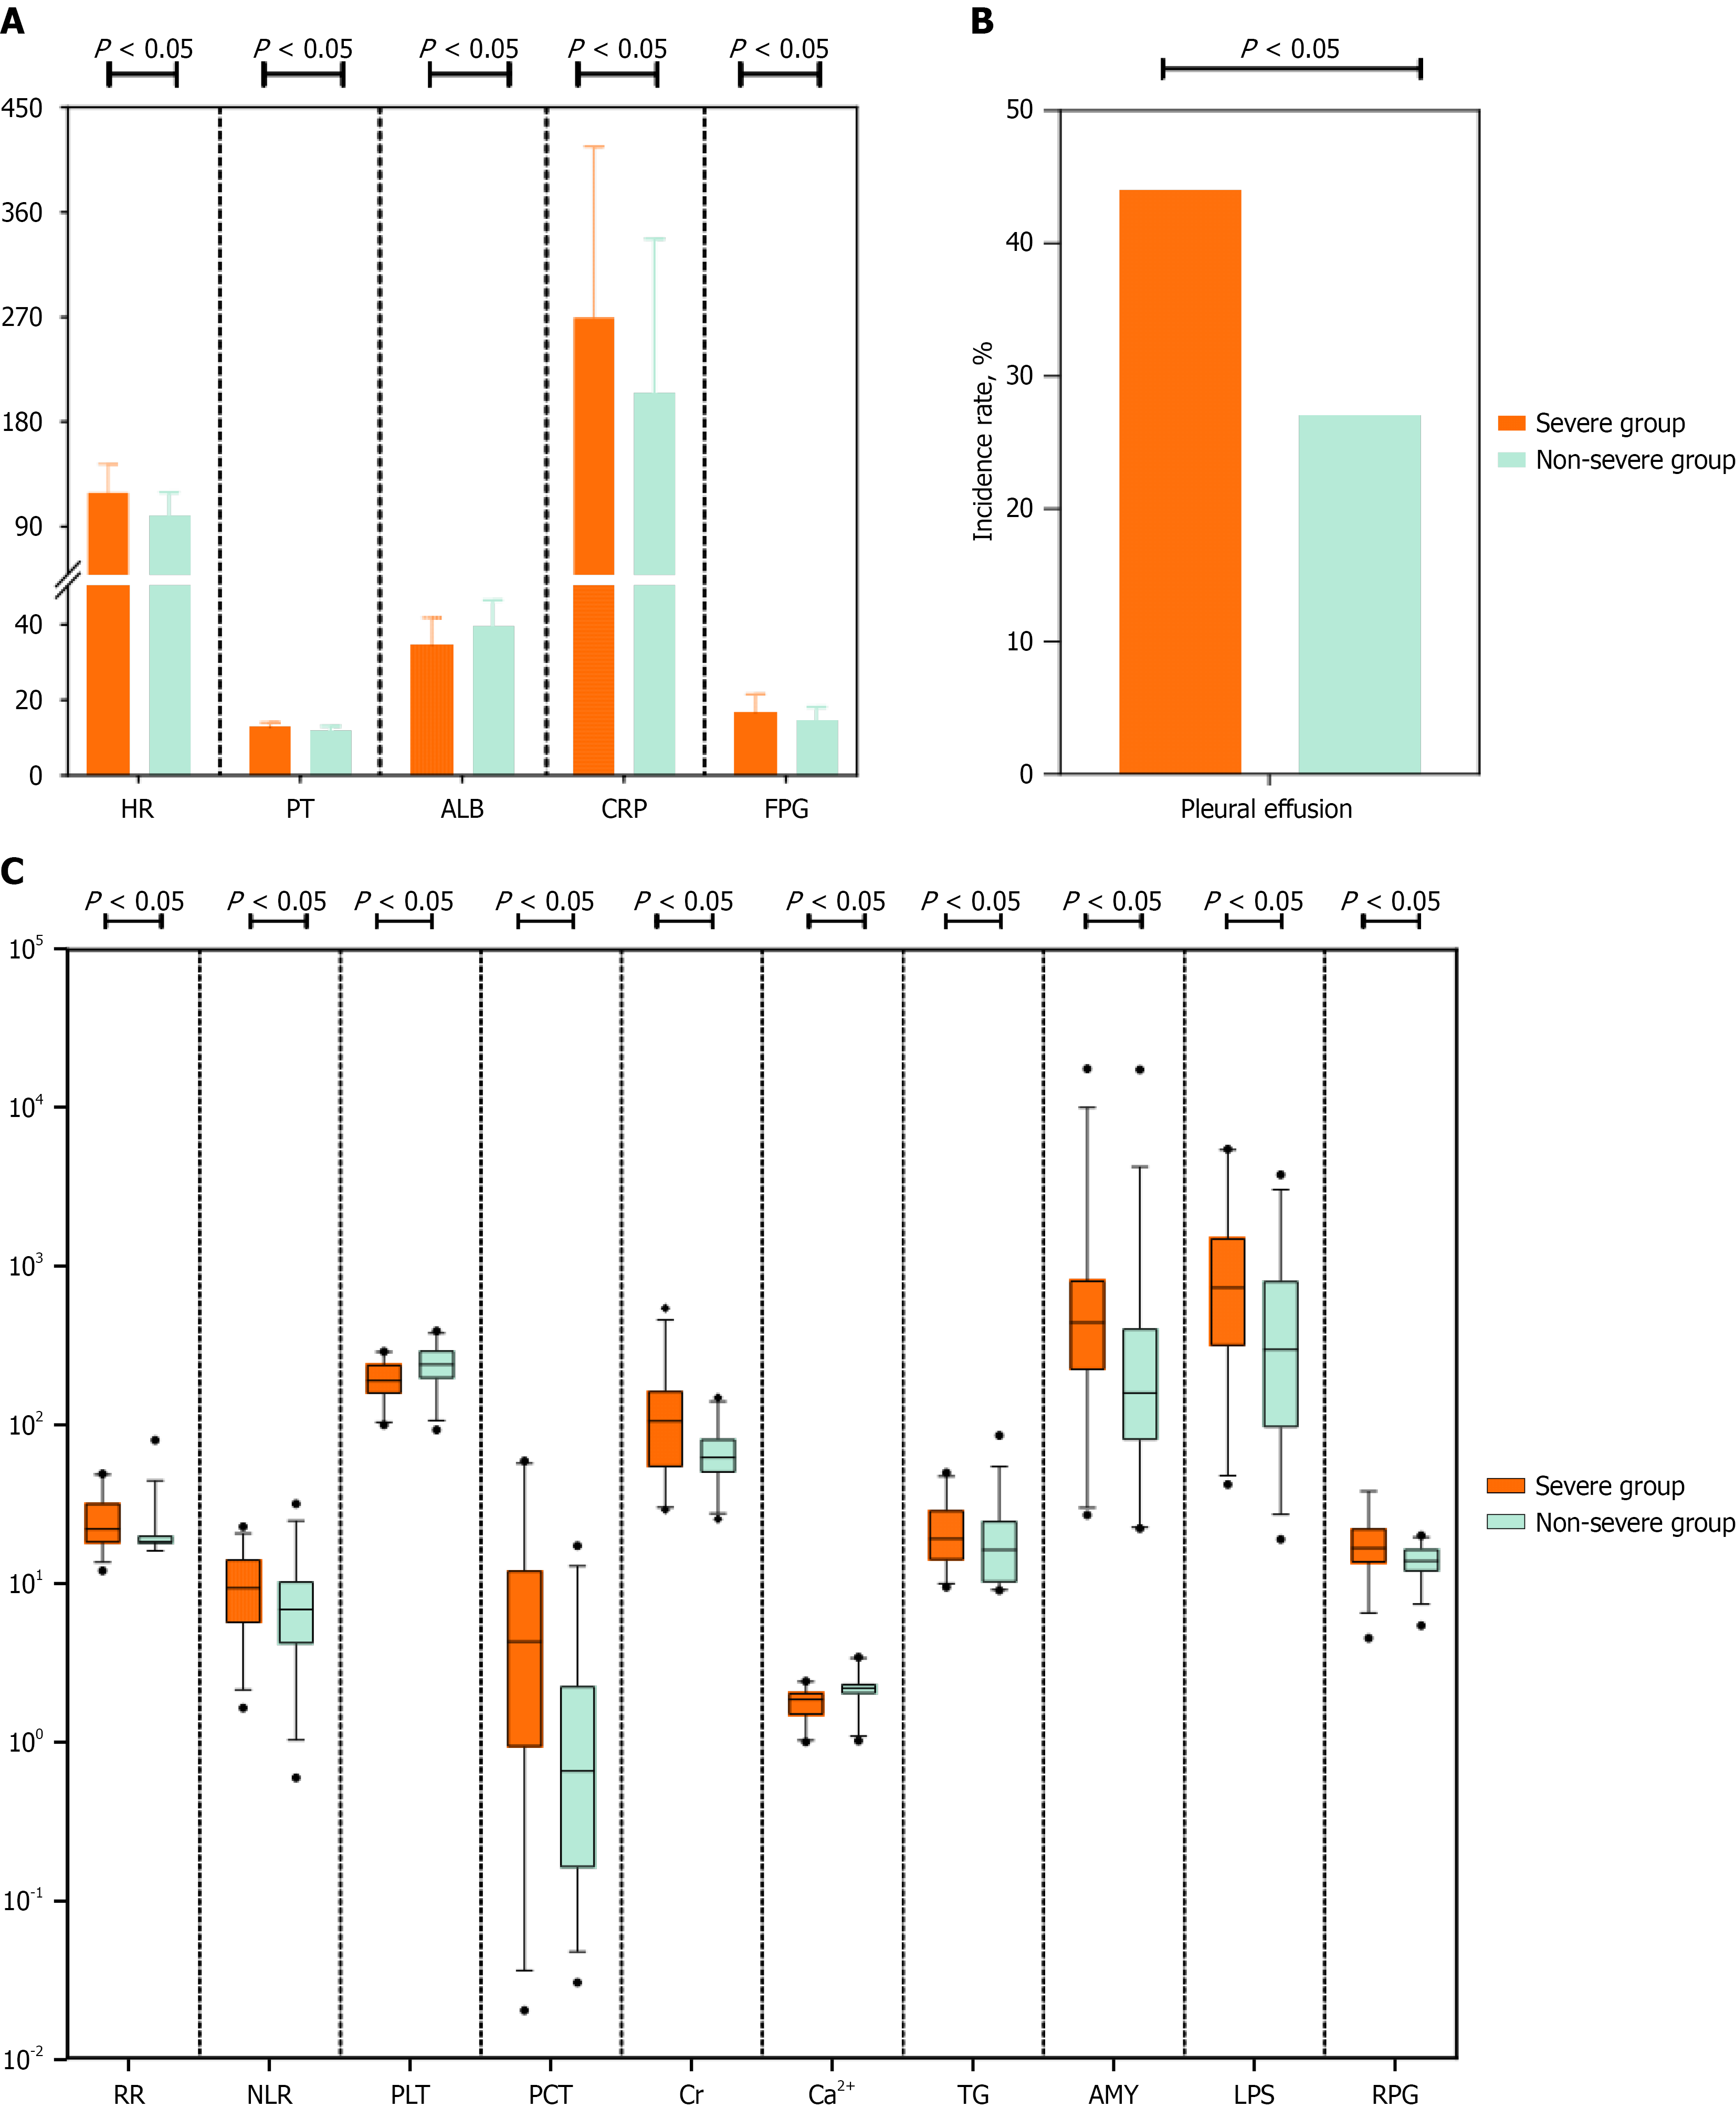
Figure 2 Graphic illustrations of clinical data in patients with hypertriglyceridemia-induced acute pancreatitis combined with diabetes mellitus.
P < 0.05. A: Bar chart of statistically significant normally distributed variables. The X-axis represents the variable names, and the Y-axis represents the variable values (units not shown); B: Bar chart of statistically significant categorical variables. The X-axis represents the variable names, and the Y-axis represents the proportions of each variable (%); C: Boxplot of statistically significant nonnormally distributed variables. The X-axis represents the variable names, and the Y-axis represents the common logarithm (log10) of the variable values (units not shown). HR: Heart rate; PT: Prothrombin time; ALB: Albumin; CRP: C-reactive protein; FPG: Fasting plasma glucose; RR: Respiratory rate; NLR: Neutrophil-to-lymphocyte ratio; PLT: Platelets; PCT: Procalcitonin; Cr: Creatinine; TG: Triglyceride; AMY: Serum amylase; LPS: Serum lipase; RPG: Random plasma glucose.
- Citation: Chai M, Zhao LX, Wang ZG, Xu DH. Hypertriglyceridemic acute pancreatitis with diabetes mellitus: Investigation of factors and predictive models for severity progression. World J Diabetes 2026; 17(10): 124186
- URL: https://www.wjgnet.com/1948-9358/full/v17/i10/124186.htm
- DOI: https://dx.doi.org/10.4239/wjd.124186