
















Copyright: ©Author(s) 2026.
World J Diabetes. Oct 15, 2026; 17(10): 123730
Published online Oct 15, 2026. doi: 10.4239/wjd.123730
Published online Oct 15, 2026. doi: 10.4239/wjd.123730
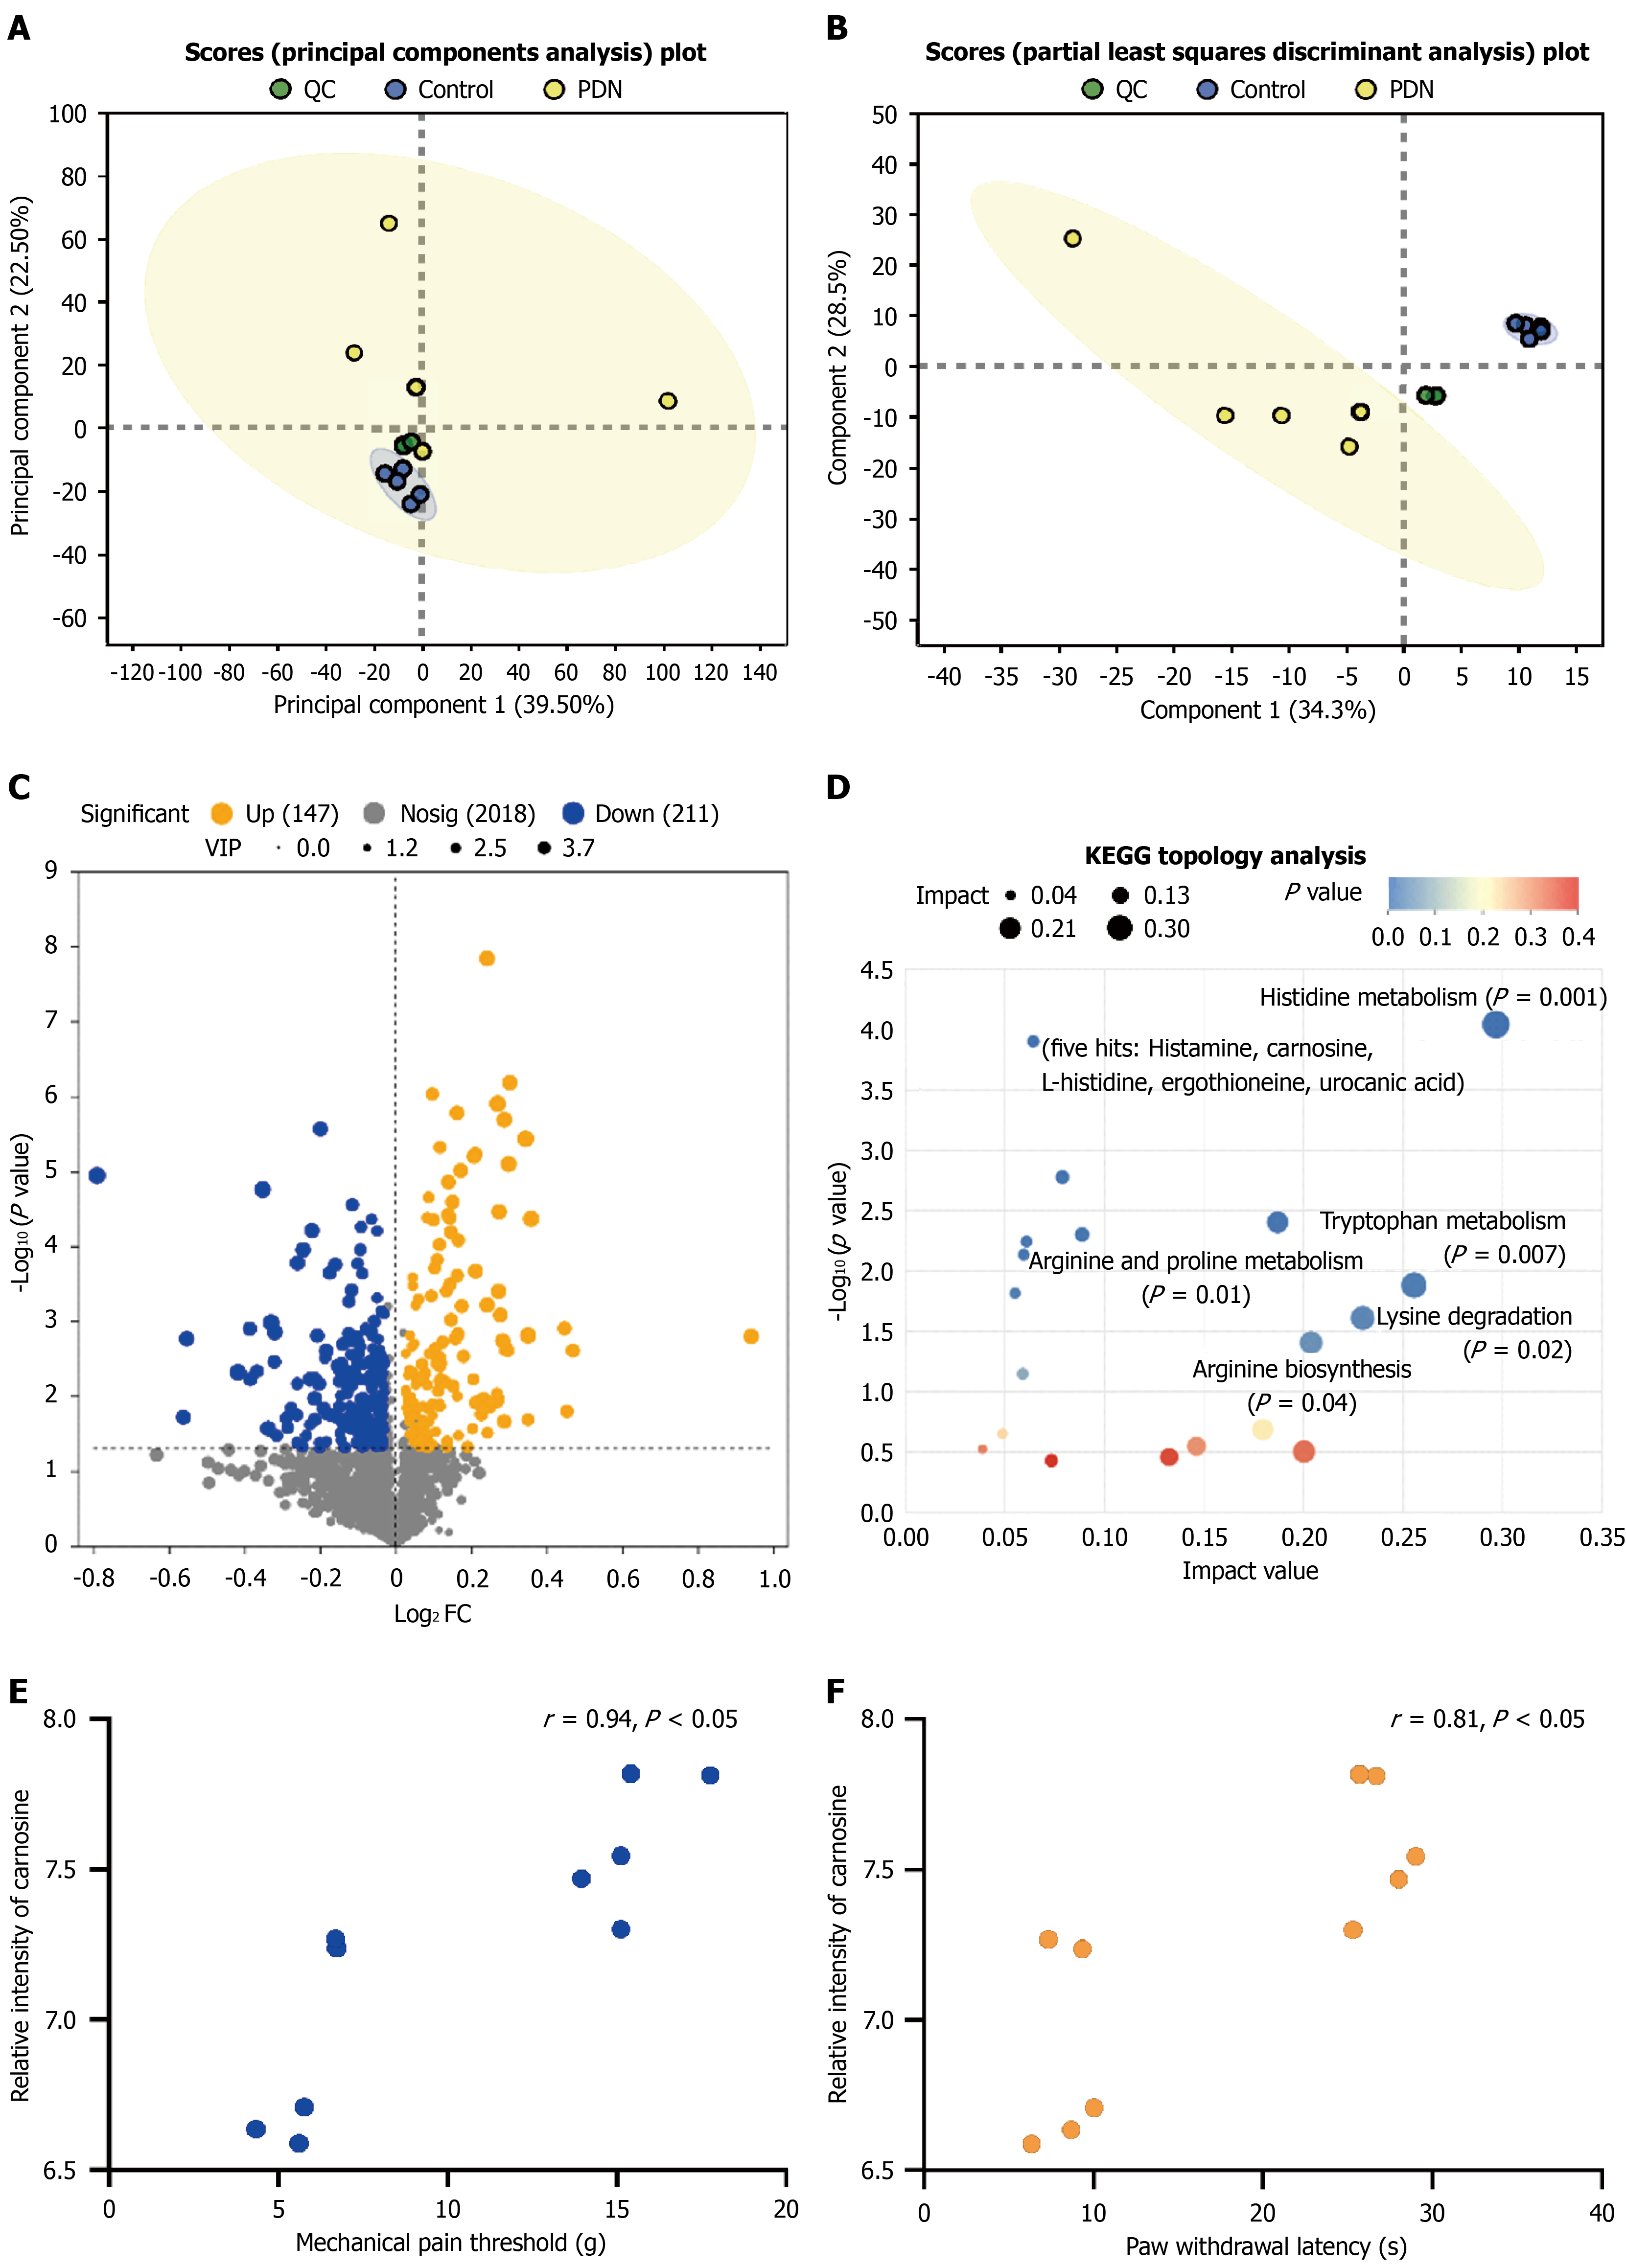
Figure 2 Dorsal root ganglia metabolomic profiling and correlation analyses between carnosine levels and behavioral pain indices, including paw withdrawal threshold and paw withdrawal latency.
A: Principal component analysis; green represents quality control, blue indicates the control group, and yellow represents painful diabetic neuropathy; B: Partial least squares discriminant analysis; green represents quality control, blue indicates the control group, and yellow represents painful diabetic neuropathy; C: Volcano plot of differential metabolites; orange indicates upregulated differential metabolites, blue indicates downregulated differential metabolites, and gray indicates metabolites detected but not significantly different; D: Kyoto Encyclopedia of Genes and Genomes topological analysis, the color gradient represents the significance of pathways arranged by P value (Y-axis, darker red indicates smaller P values), while the size of circles represents pathway impact values (X-axis, larger circles indicate higher pathway impact value scores); pathway enrichment was analyzed using a hypergeometric test, and P values were adjusted for multiple comparisons using the Benjamini-Hochberg method to control the false discovery rate (corrected P < 0.05); E and F: Correlation analysis between carnosine levels and behavioral pain indices, including paw withdrawal threshold and paw withdrawal latency. n = 5 animals per group. QC: Quality control; PDN: Painful diabetic neuropathy; KEGG: Kyoto Encyclopedia of Genes and Genomes.
- Citation: Yu ZY, Yang J, Jiang Y, Han YZ, Wei M, Shou JY, Shen SX, Lyu YH, Li XS, Chen Q, Zhao XR, Xing GG, Ma DQ, Li M. Preventive carnosine supplementation attenuates painful diabetic neuropathy via restoring mitochondrial function and suppressing inflammasome activation. World J Diabetes 2026; 17(10): 123730
- URL: https://www.wjgnet.com/1948-9358/full/v17/i10/123730.htm
- DOI: https://dx.doi.org/10.4239/wjd.123730