
















©The Author(s) 2026.
World J Diabetes. Jan 15, 2026; 17(1): 112885
Published online Jan 15, 2026. doi: 10.4239/wjd.v17.i1.112885
Published online Jan 15, 2026. doi: 10.4239/wjd.v17.i1.112885
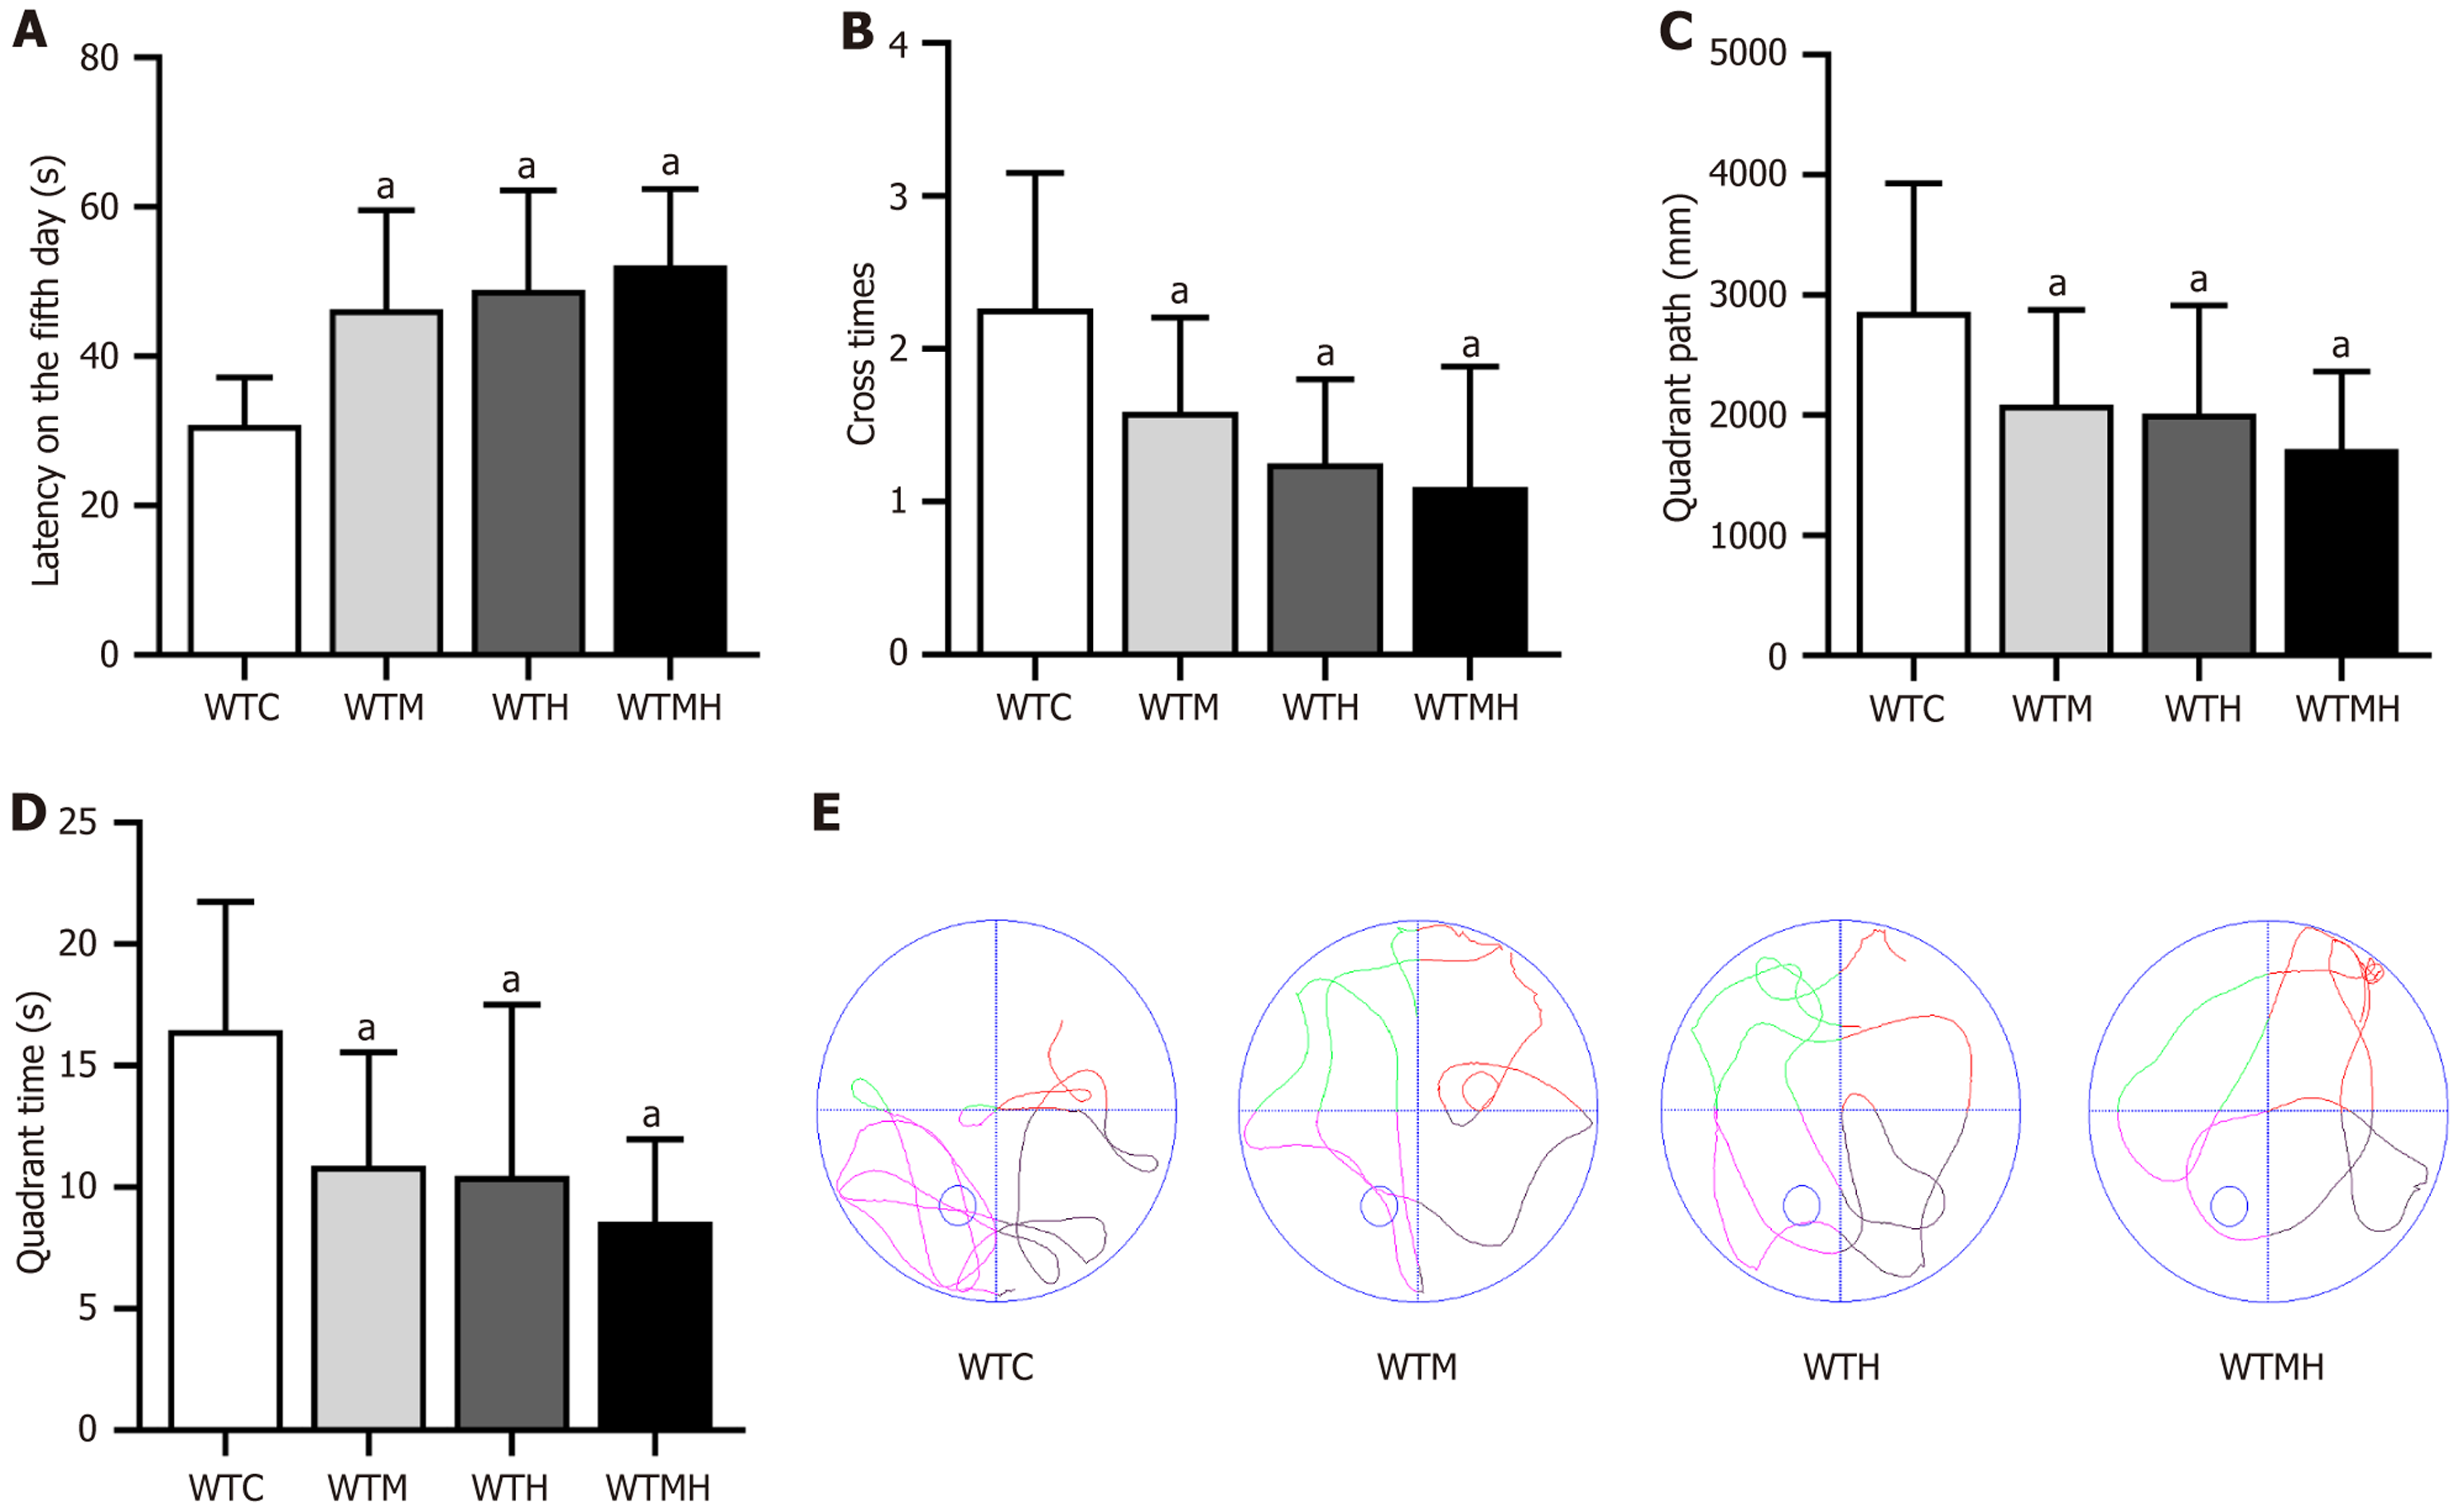
Figure 3 Results of the Morris water maze experiment in mice.
A: Escape latency period of each group of mice on the fifth day; B: Platform crossing frequency of each group of mice; C: Target quadrant time of each group of mice; D: Target quadrant swim distance of each group of mice; E: Representative figure of swimming trajectories of each group of mice in the spatial exploration test. Sample size: WTC: 20, WTM: 20, WTH: 20, WTMH: 20. aP < 0.05 vs control group. WTC: Control group; WTM: Diabetes group; WTH: Lead exposure group; WTMH: Diabetes with lead exposure group.
- Citation: Ding WJ, Liu CQ, Tang XY, Shang ZB, Liang X, Tao T, Liu RX, Jiang QY, Qiu YF, Sun Y. Role of gut microbiota in lead-induced neural damage in diabetic mice. World J Diabetes 2026; 17(1): 112885
- URL: https://www.wjgnet.com/1948-9358/full/v17/i1/112885.htm
- DOI: https://dx.doi.org/10.4239/wjd.v17.i1.112885