
















©The Author(s) 2026.
World J Diabetes. Jan 15, 2026; 17(1): 112027
Published online Jan 15, 2026. doi: 10.4239/wjd.v17.i1.112027
Published online Jan 15, 2026. doi: 10.4239/wjd.v17.i1.112027
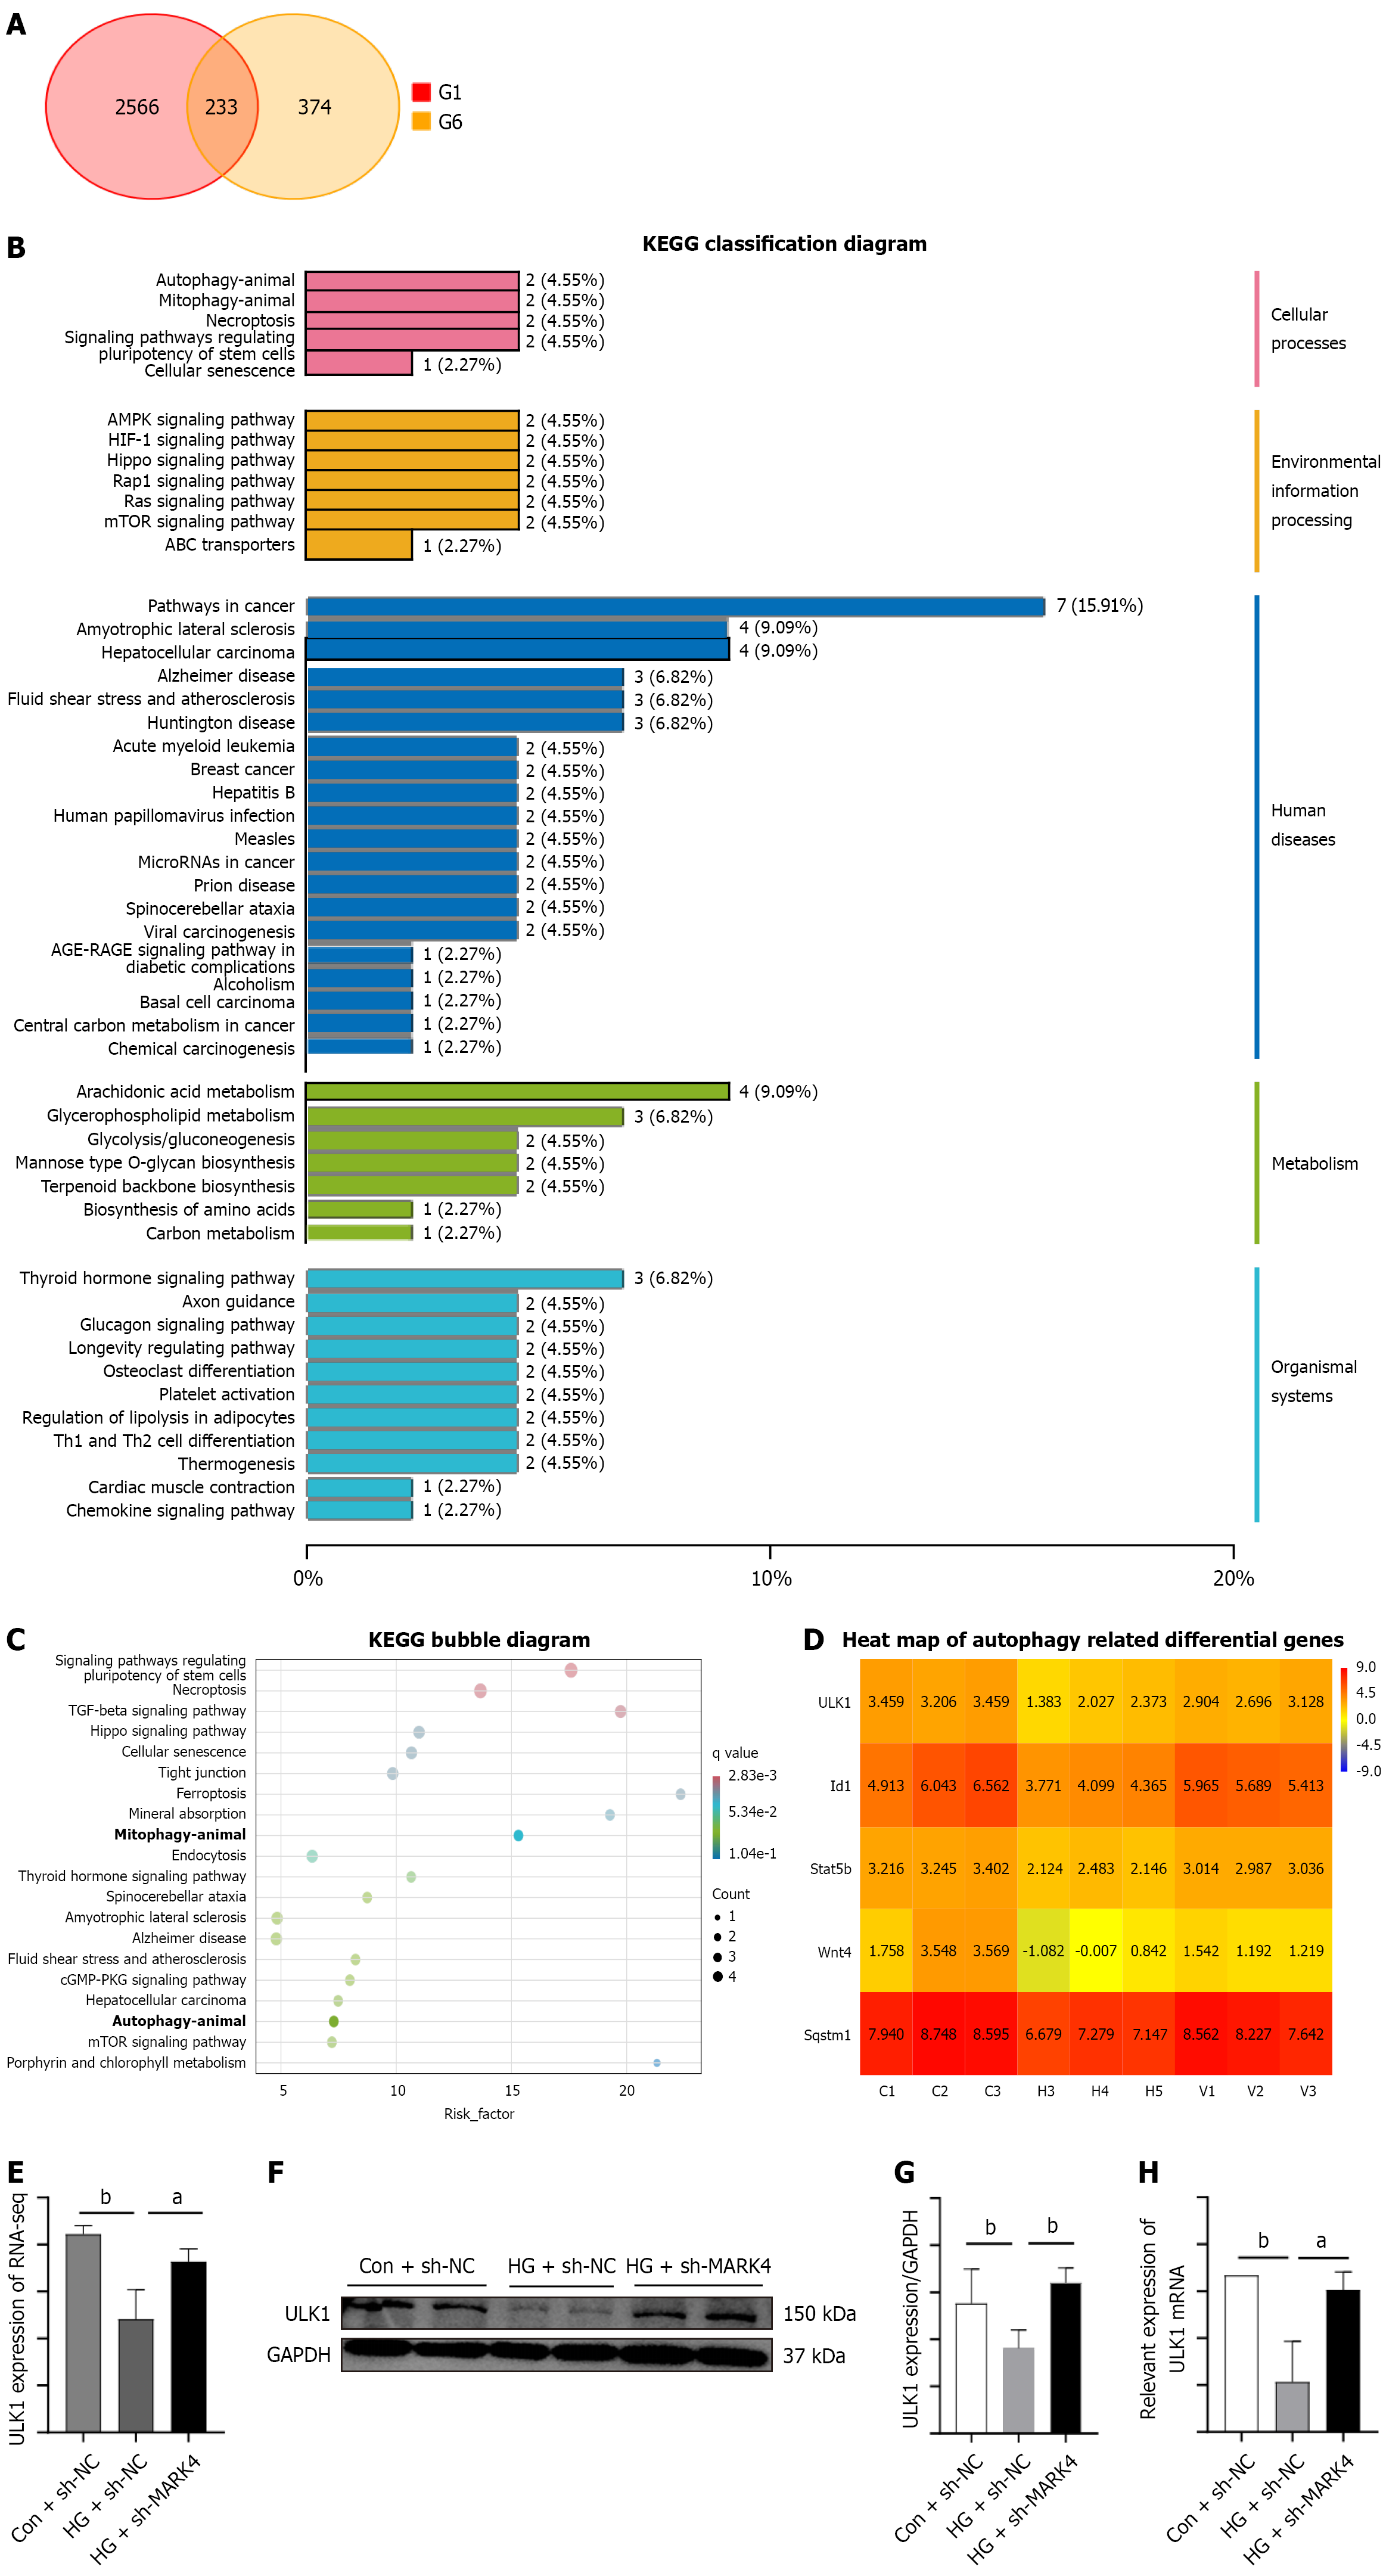
Figure 5 Transcriptomic results and verification of the effects of microtubule affinity-regulating kinase 4 knockdown.
A: Downregulated genes between the control + small hairpin (sh)-negative control (NC) and high glucose (HG) + sh-NC groups and upregulated genes between the HG + sh-NC and HG + sh-microtubule affinity-regulating kinase 4 groups are shown as a cross-Venn diagram; B: Kyoto Encyclopedia of Genes and Genomes classification of differentially expressed genes; C: Kyoto Encyclopedia of Genes and Genomes bubble diagram of the differentially expressed genes; D: Heatmap of differentially expressed genes; E: RNA-seq results of UNC-51-like kinase 1; F-H: Consistency of the western blotting, quantitative real-time PCR, and RNA-seq results. Values are shown as mean ± SD (n = 4). aP < 0.05, and bP < 0.01. KEGG: Kyoto Encyclopedia of Genes and Genomes; ULK1: UNC-51-like kinase 1; Con: Control; NC: Negative control; sh: Small hairpin; MARK4: Microtubule affinity-regulating kinase 4; GAPDH: Glyceraldehyde 3-phosphate dehydrogenase; HG: High glucose.
- Citation: Wu Y, Wang WY, Zhang JQ, Wang S, Zeng Z, Fu L, Li B. Microtubule affinity-regulating kinase 4 exacerbates diabetic cardiomyopathy by inhibiting UNC-51-like kinase 1-mediated mitochondrial autophagy. World J Diabetes 2026; 17(1): 112027
- URL: https://www.wjgnet.com/1948-9358/full/v17/i1/112027.htm
- DOI: https://dx.doi.org/10.4239/wjd.v17.i1.112027