
















©The Author(s) 2026.
World J Diabetes. Jan 15, 2026; 17(1): 112027
Published online Jan 15, 2026. doi: 10.4239/wjd.v17.i1.112027
Published online Jan 15, 2026. doi: 10.4239/wjd.v17.i1.112027
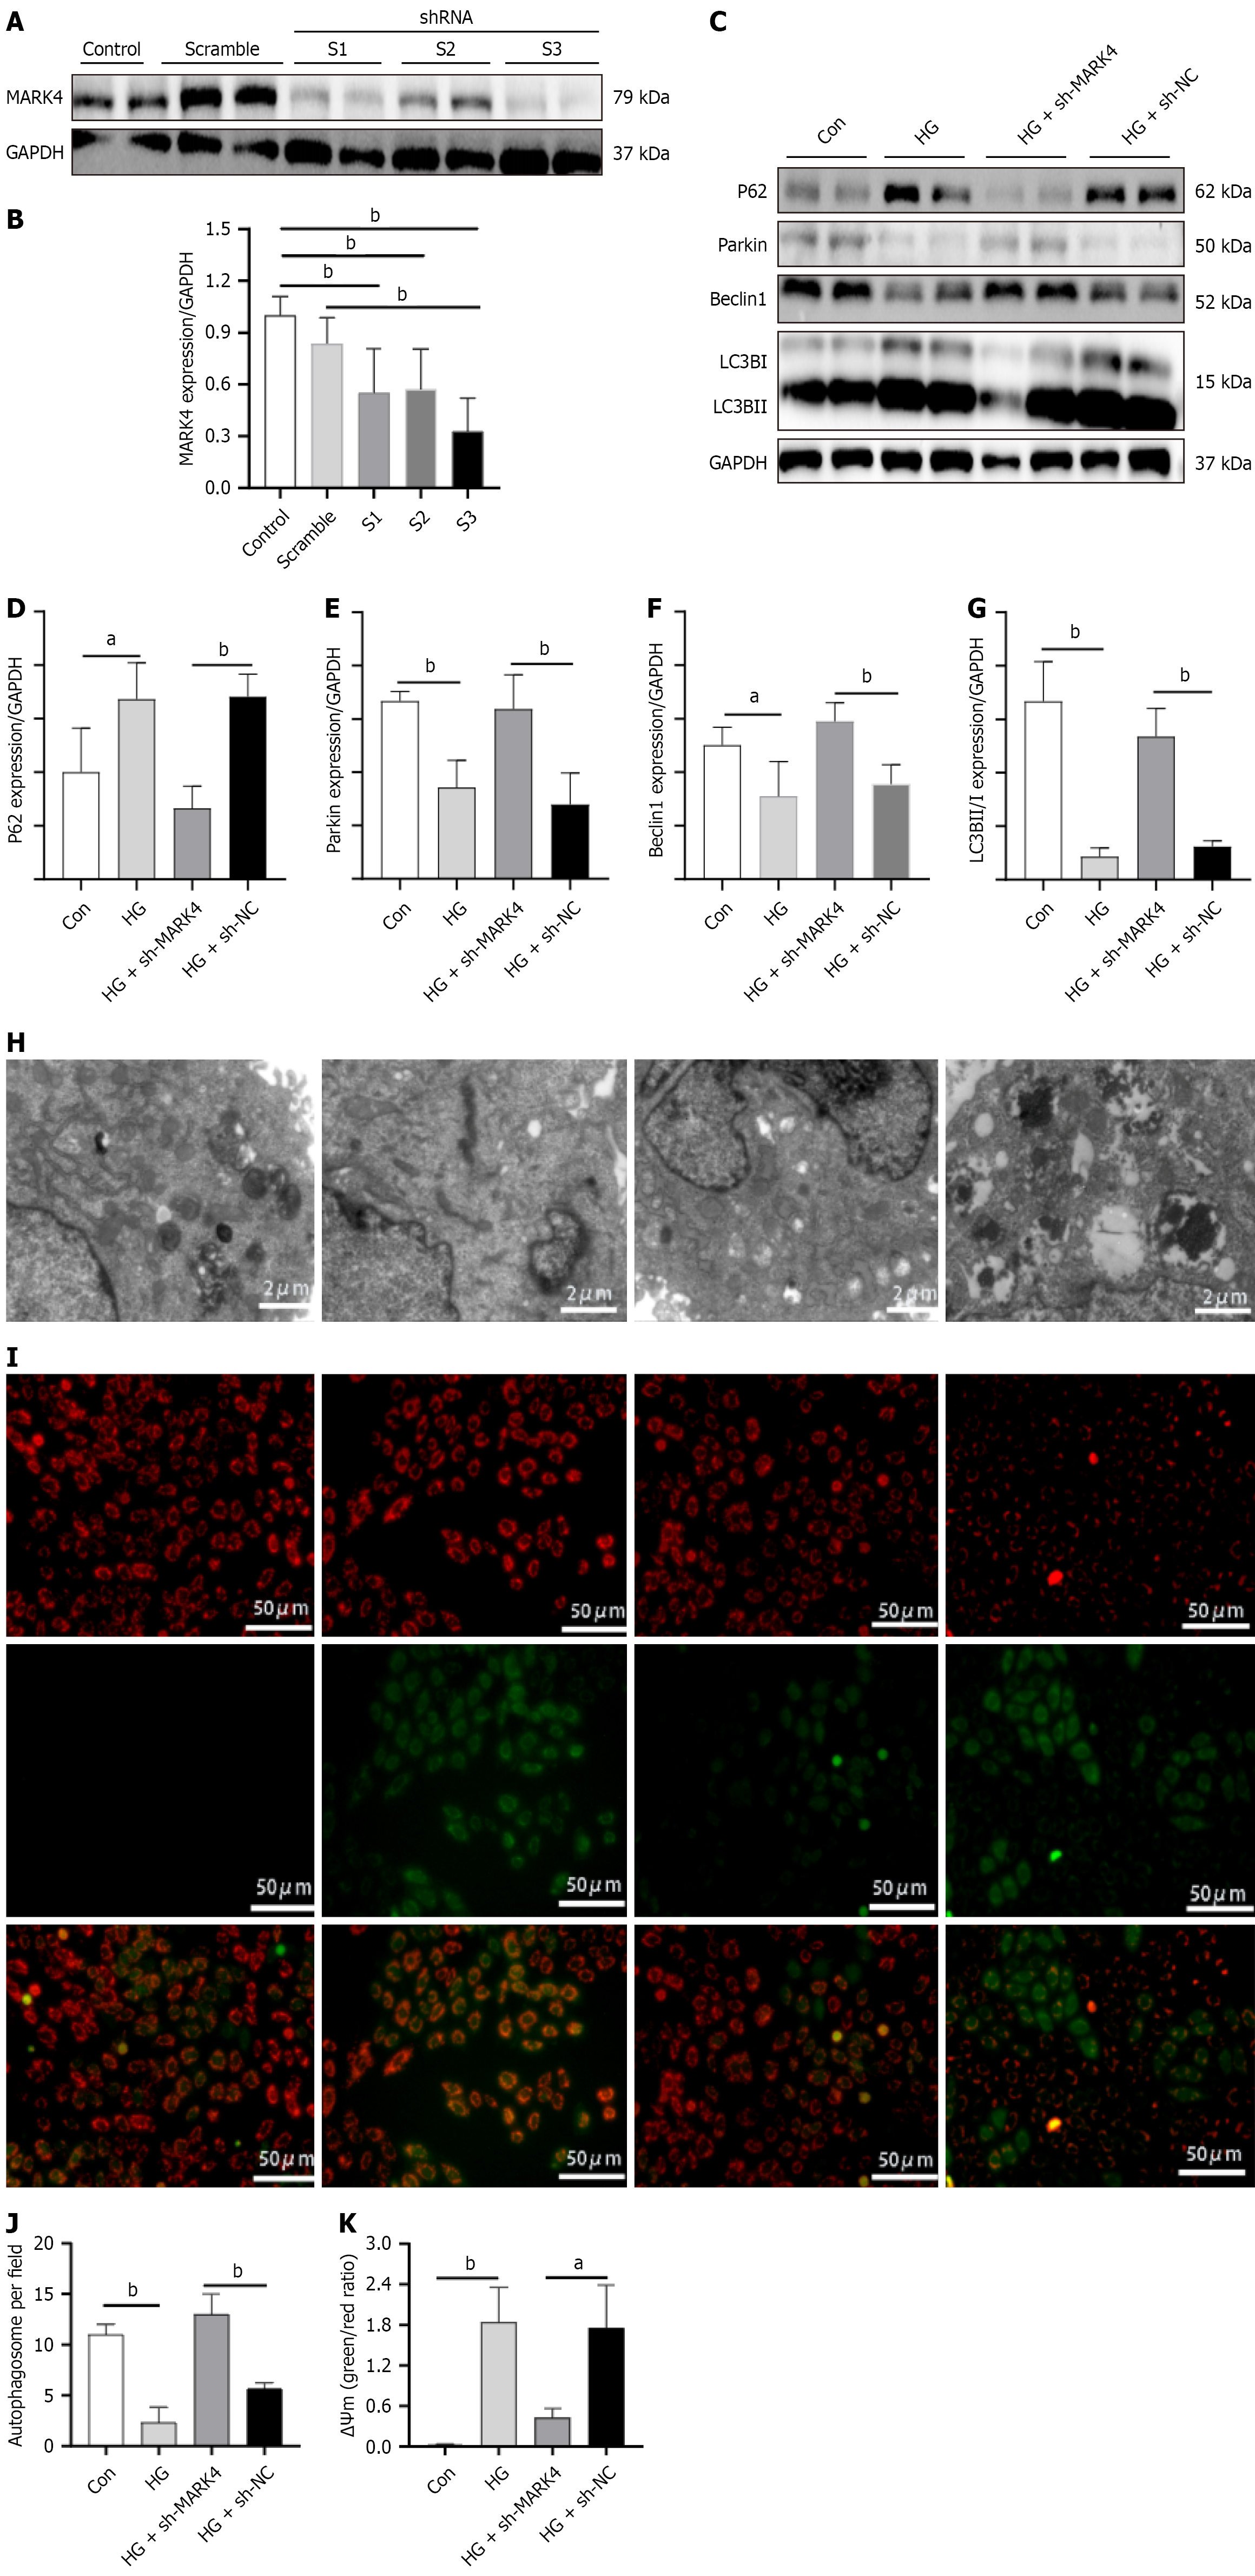
Figure 4 Effect of microtubule affinity-regulating kinase 4 knockdown on mitophagy and mitochondrial membrane potentials in car
- Citation: Wu Y, Wang WY, Zhang JQ, Wang S, Zeng Z, Fu L, Li B. Microtubule affinity-regulating kinase 4 exacerbates diabetic cardiomyopathy by inhibiting UNC-51-like kinase 1-mediated mitochondrial autophagy. World J Diabetes 2026; 17(1): 112027
- URL: https://www.wjgnet.com/1948-9358/full/v17/i1/112027.htm
- DOI: https://dx.doi.org/10.4239/wjd.v17.i1.112027