
















©The Author(s) 2026.
World J Diabetes. Jan 15, 2026; 17(1): 111165
Published online Jan 15, 2026. doi: 10.4239/wjd.v17.i1.111165
Published online Jan 15, 2026. doi: 10.4239/wjd.v17.i1.111165
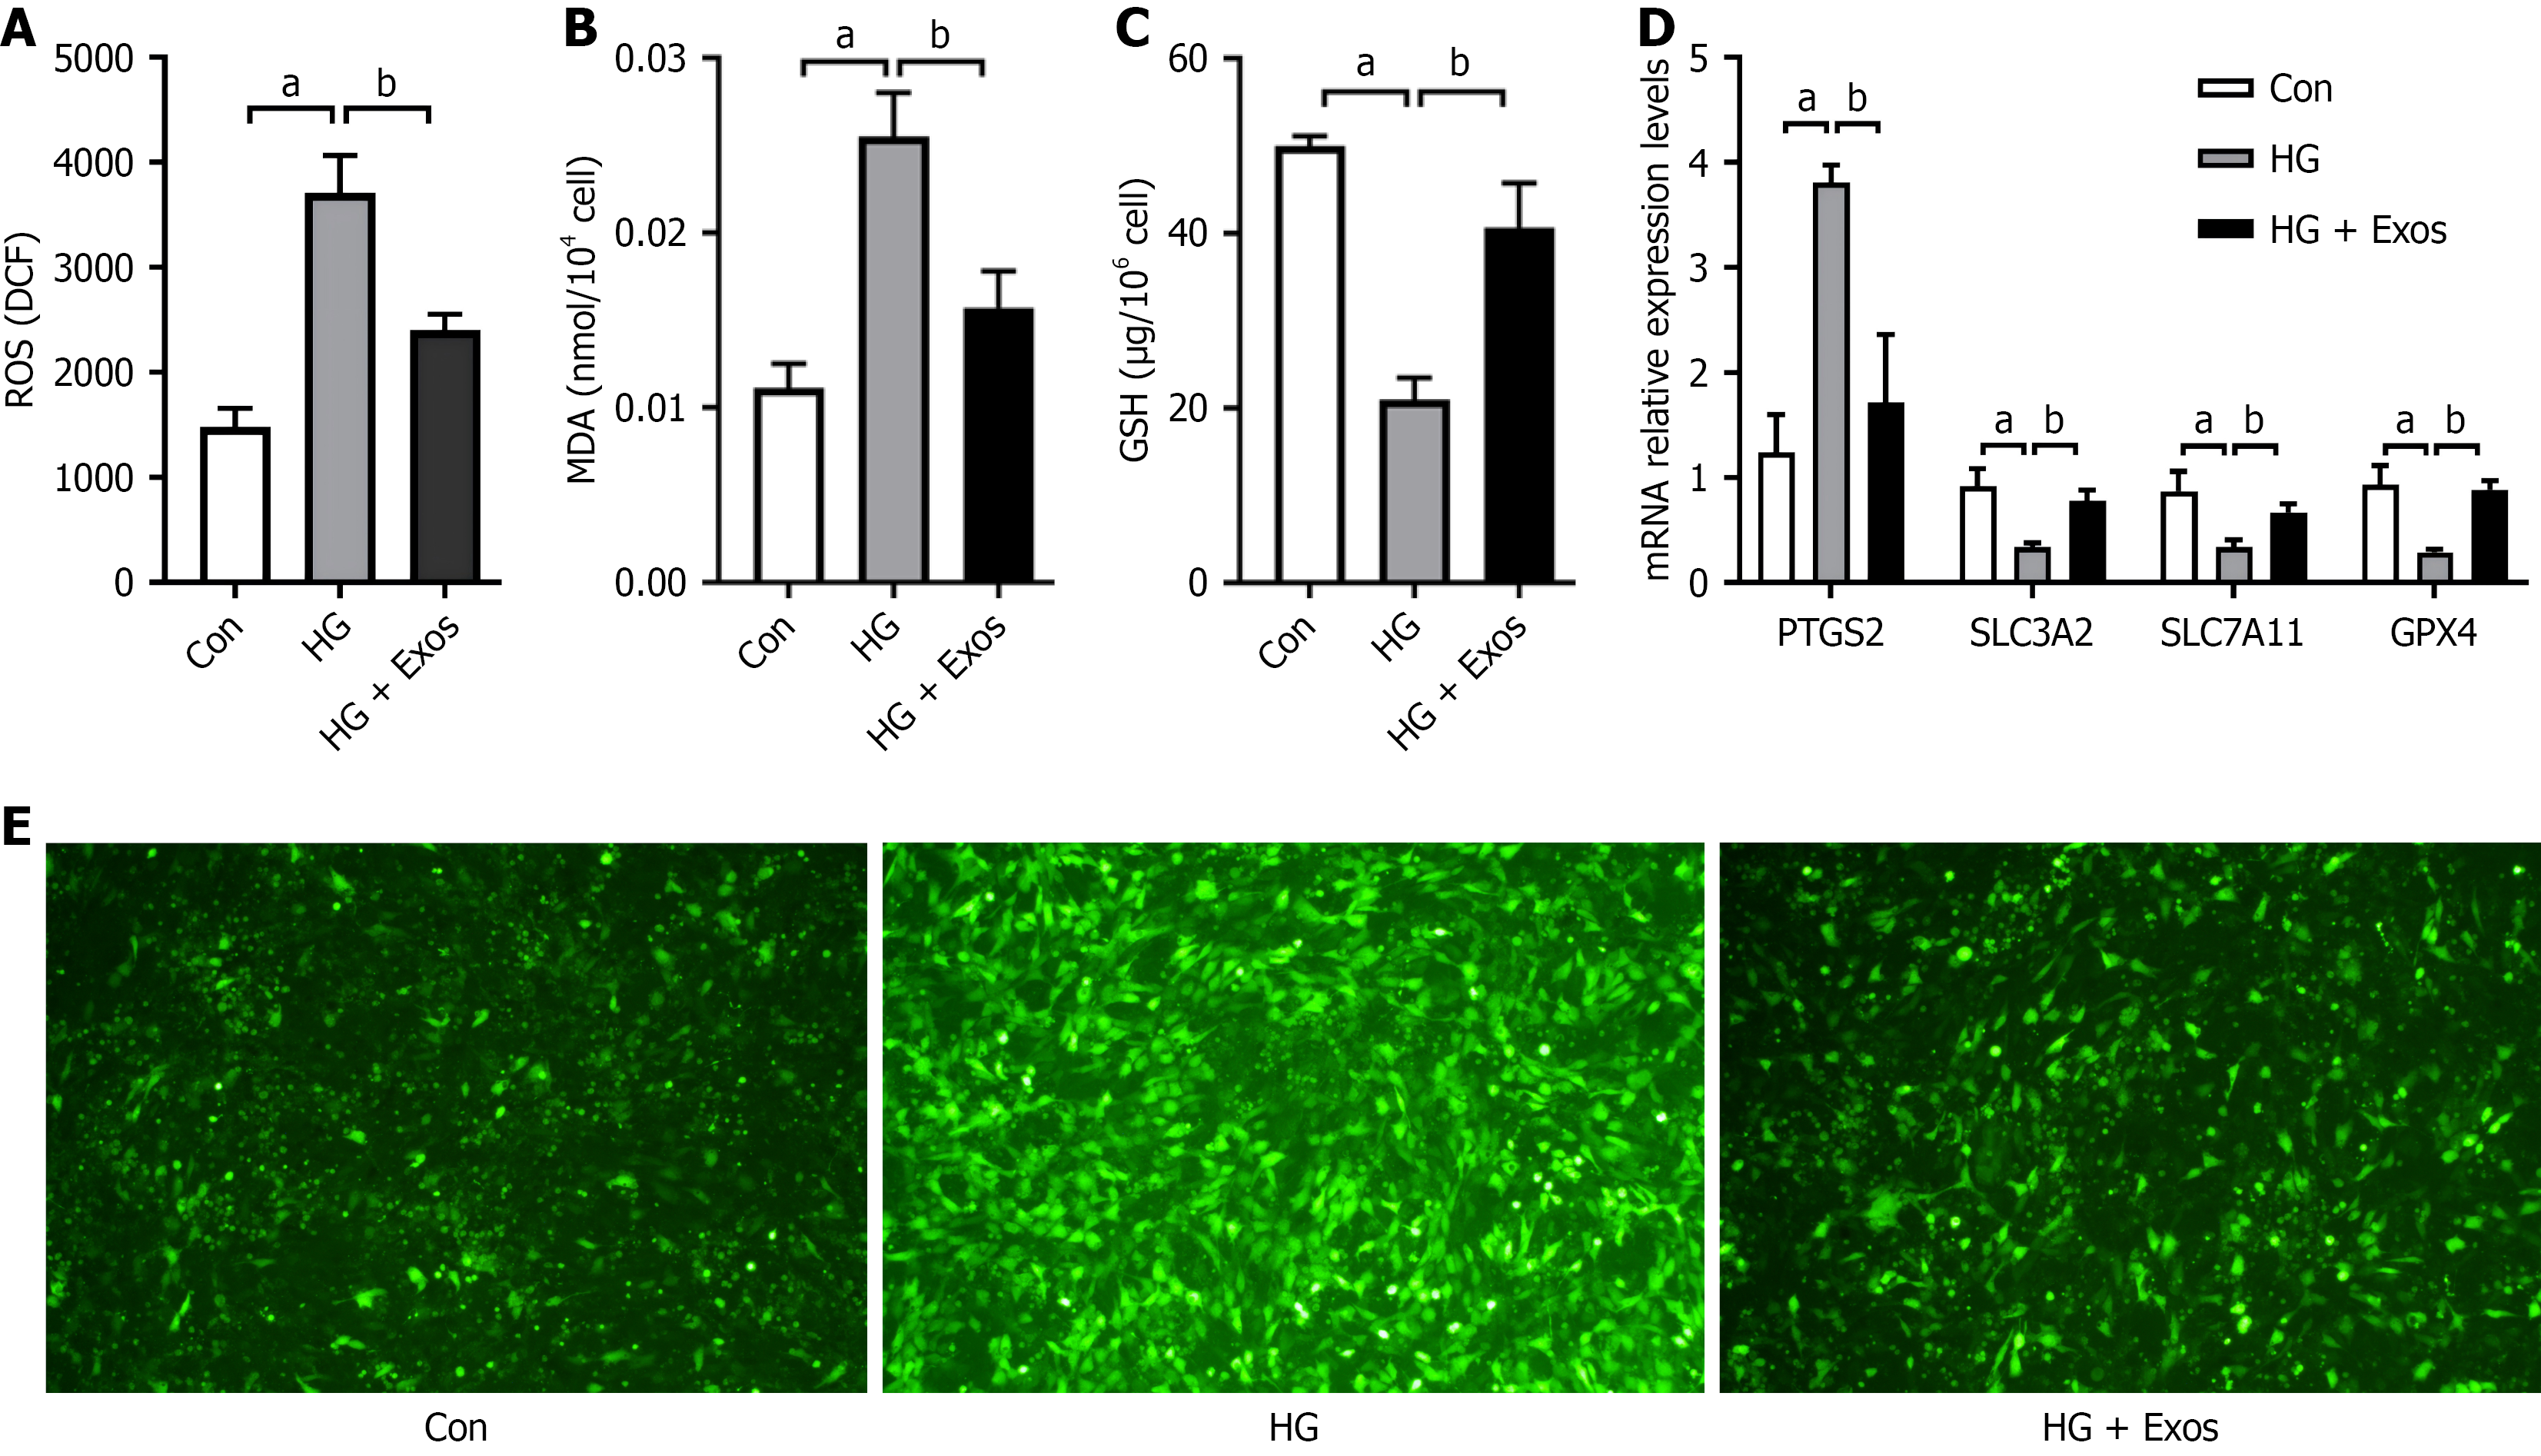
Figure 2 Endothelial cell-exosomes attenuate high glucose-induced oxidative stress and ferroptosis.
A-C: Comparison of reactive oxygen species levels, malondialdehyde levels and glutathione levels among the control group, high glucose (HG) group, and HG + exosomes (Exos) group; D: Reactive oxygen species fluorescence images of the control group, HG group, and HG + Exos group; E: Comparison of mRNA expression levels of ferroptosis indicators prostaglandin endoperoxide synthase 2, solute carrier family 3 member 2, solute carrier family 7 member 11, glutathione peroxidase 4 among the control group, HG group, and HG + Exos group. The bars indicate the mean ± SD from three independent experiments (n = 3). aP < 0.05 vs control, bP < 0.05 vs high glucose. Con: Osteoblasts treated with normal glucose; HG: Osteoblasts treated with high glucose; HG + Exos: High glucose + endothelial cell-exosomes; ROS: Reactive oxygen species; DCF: Dichlorofluorescein; MDA: Malondialdehyde; GSH: Glutathione; PTGS2: Prostaglandin endoperoxide synthase 2; SLC3A2: Solute carrier family 3 member 2; SLC7A11: Solute carrier family 7 member 11; GPX4: Glutathione peroxidase 4.
- Citation: Shao C, Zhang LJ, Song YL, Wang YQ, Zha XJ, Li J, Ye CS, Chen LL, Chen MW, Jin GX. Endothelial cell-derived exosomes inhibit high glucose-induced osteoblast ferroptosis by activating microRNA-335-3p/prostaglandin endoperoxide synthase 2. World J Diabetes 2026; 17(1): 111165
- URL: https://www.wjgnet.com/1948-9358/full/v17/i1/111165.htm
- DOI: https://dx.doi.org/10.4239/wjd.v17.i1.111165