
















©The Author(s) 2025.
World J Diabetes. Sep 15, 2025; 16(9): 110183
Published online Sep 15, 2025. doi: 10.4239/wjd.v16.i9.110183
Published online Sep 15, 2025. doi: 10.4239/wjd.v16.i9.110183
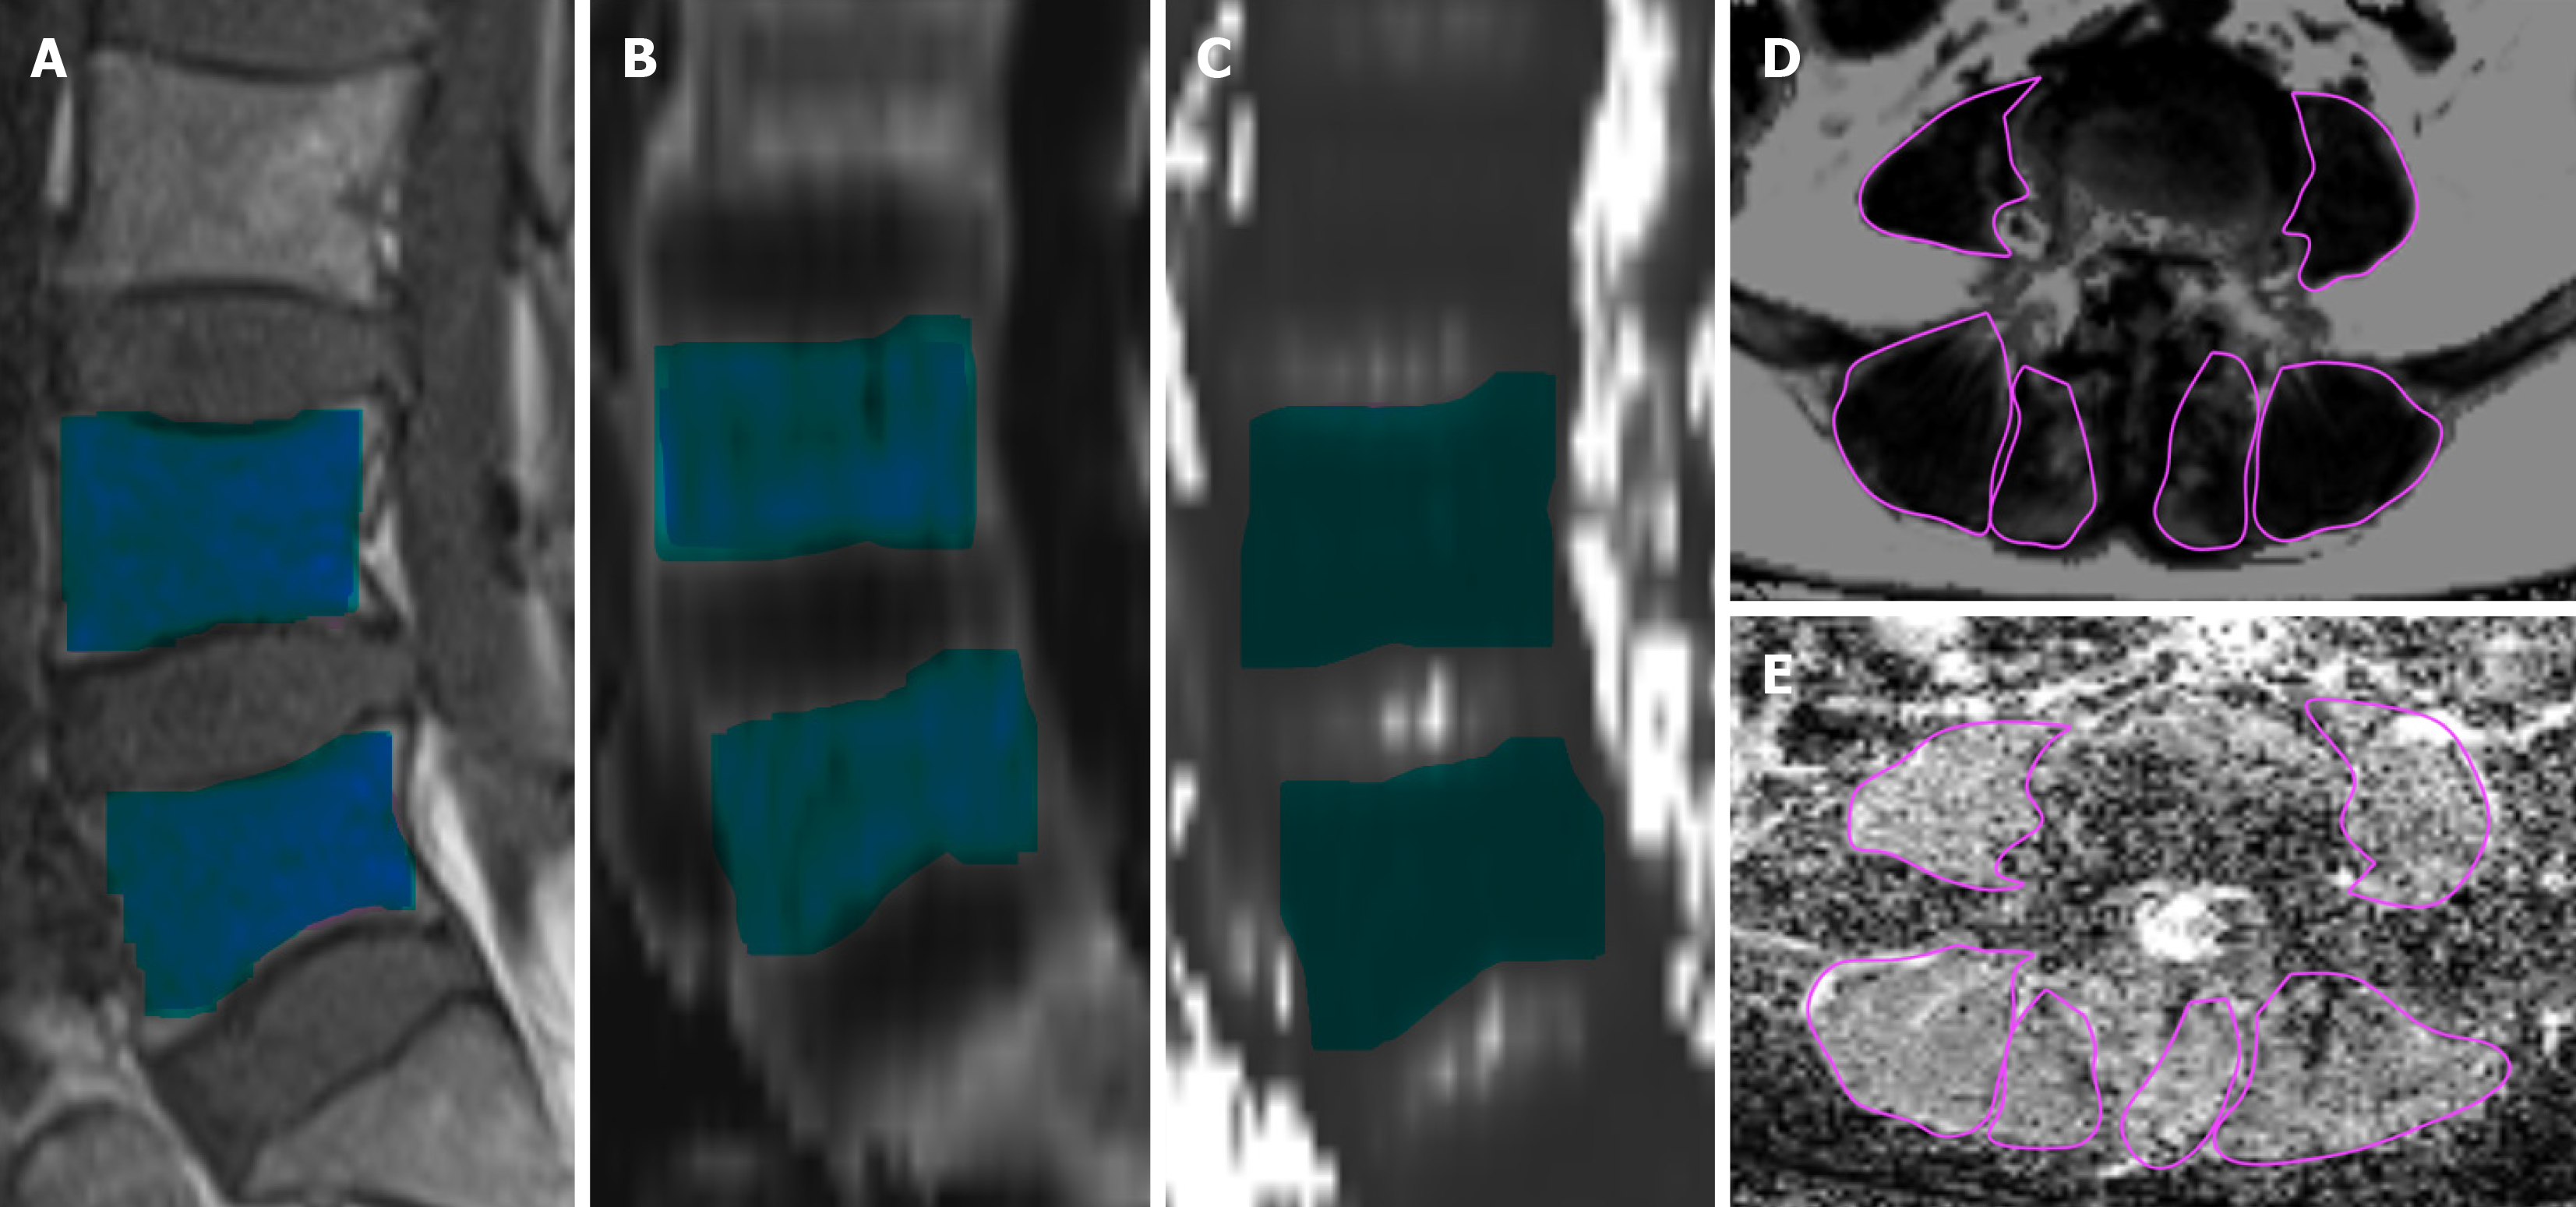
Figure 2 Illustrations of the measurements.
Blue squares represent the regions of interest in L4 and L5 vertebrae, and purple regions represent the paravertebral muscles. A: Sagittal T1-weighted imaging; B: R2* maps; C: T2* maps; D: Fat fraction; E: Diffusion tensor imaging.
- Citation: Hou BW, Ran Z, Li YT, Zhang J, Chu YQ, Gharaibeh NM, Li XM. Magnetic resonance imaging derived biomarkers for the diagnosis of type 2 diabetes with insulin resistance: A pilot study. World J Diabetes 2025; 16(9): 110183
- URL: https://www.wjgnet.com/1948-9358/full/v16/i9/110183.htm
- DOI: https://dx.doi.org/10.4239/wjd.v16.i9.110183