
















©The Author(s) 2025.
World J Diabetes. Sep 15, 2025; 16(9): 109553
Published online Sep 15, 2025. doi: 10.4239/wjd.v16.i9.109553
Published online Sep 15, 2025. doi: 10.4239/wjd.v16.i9.109553
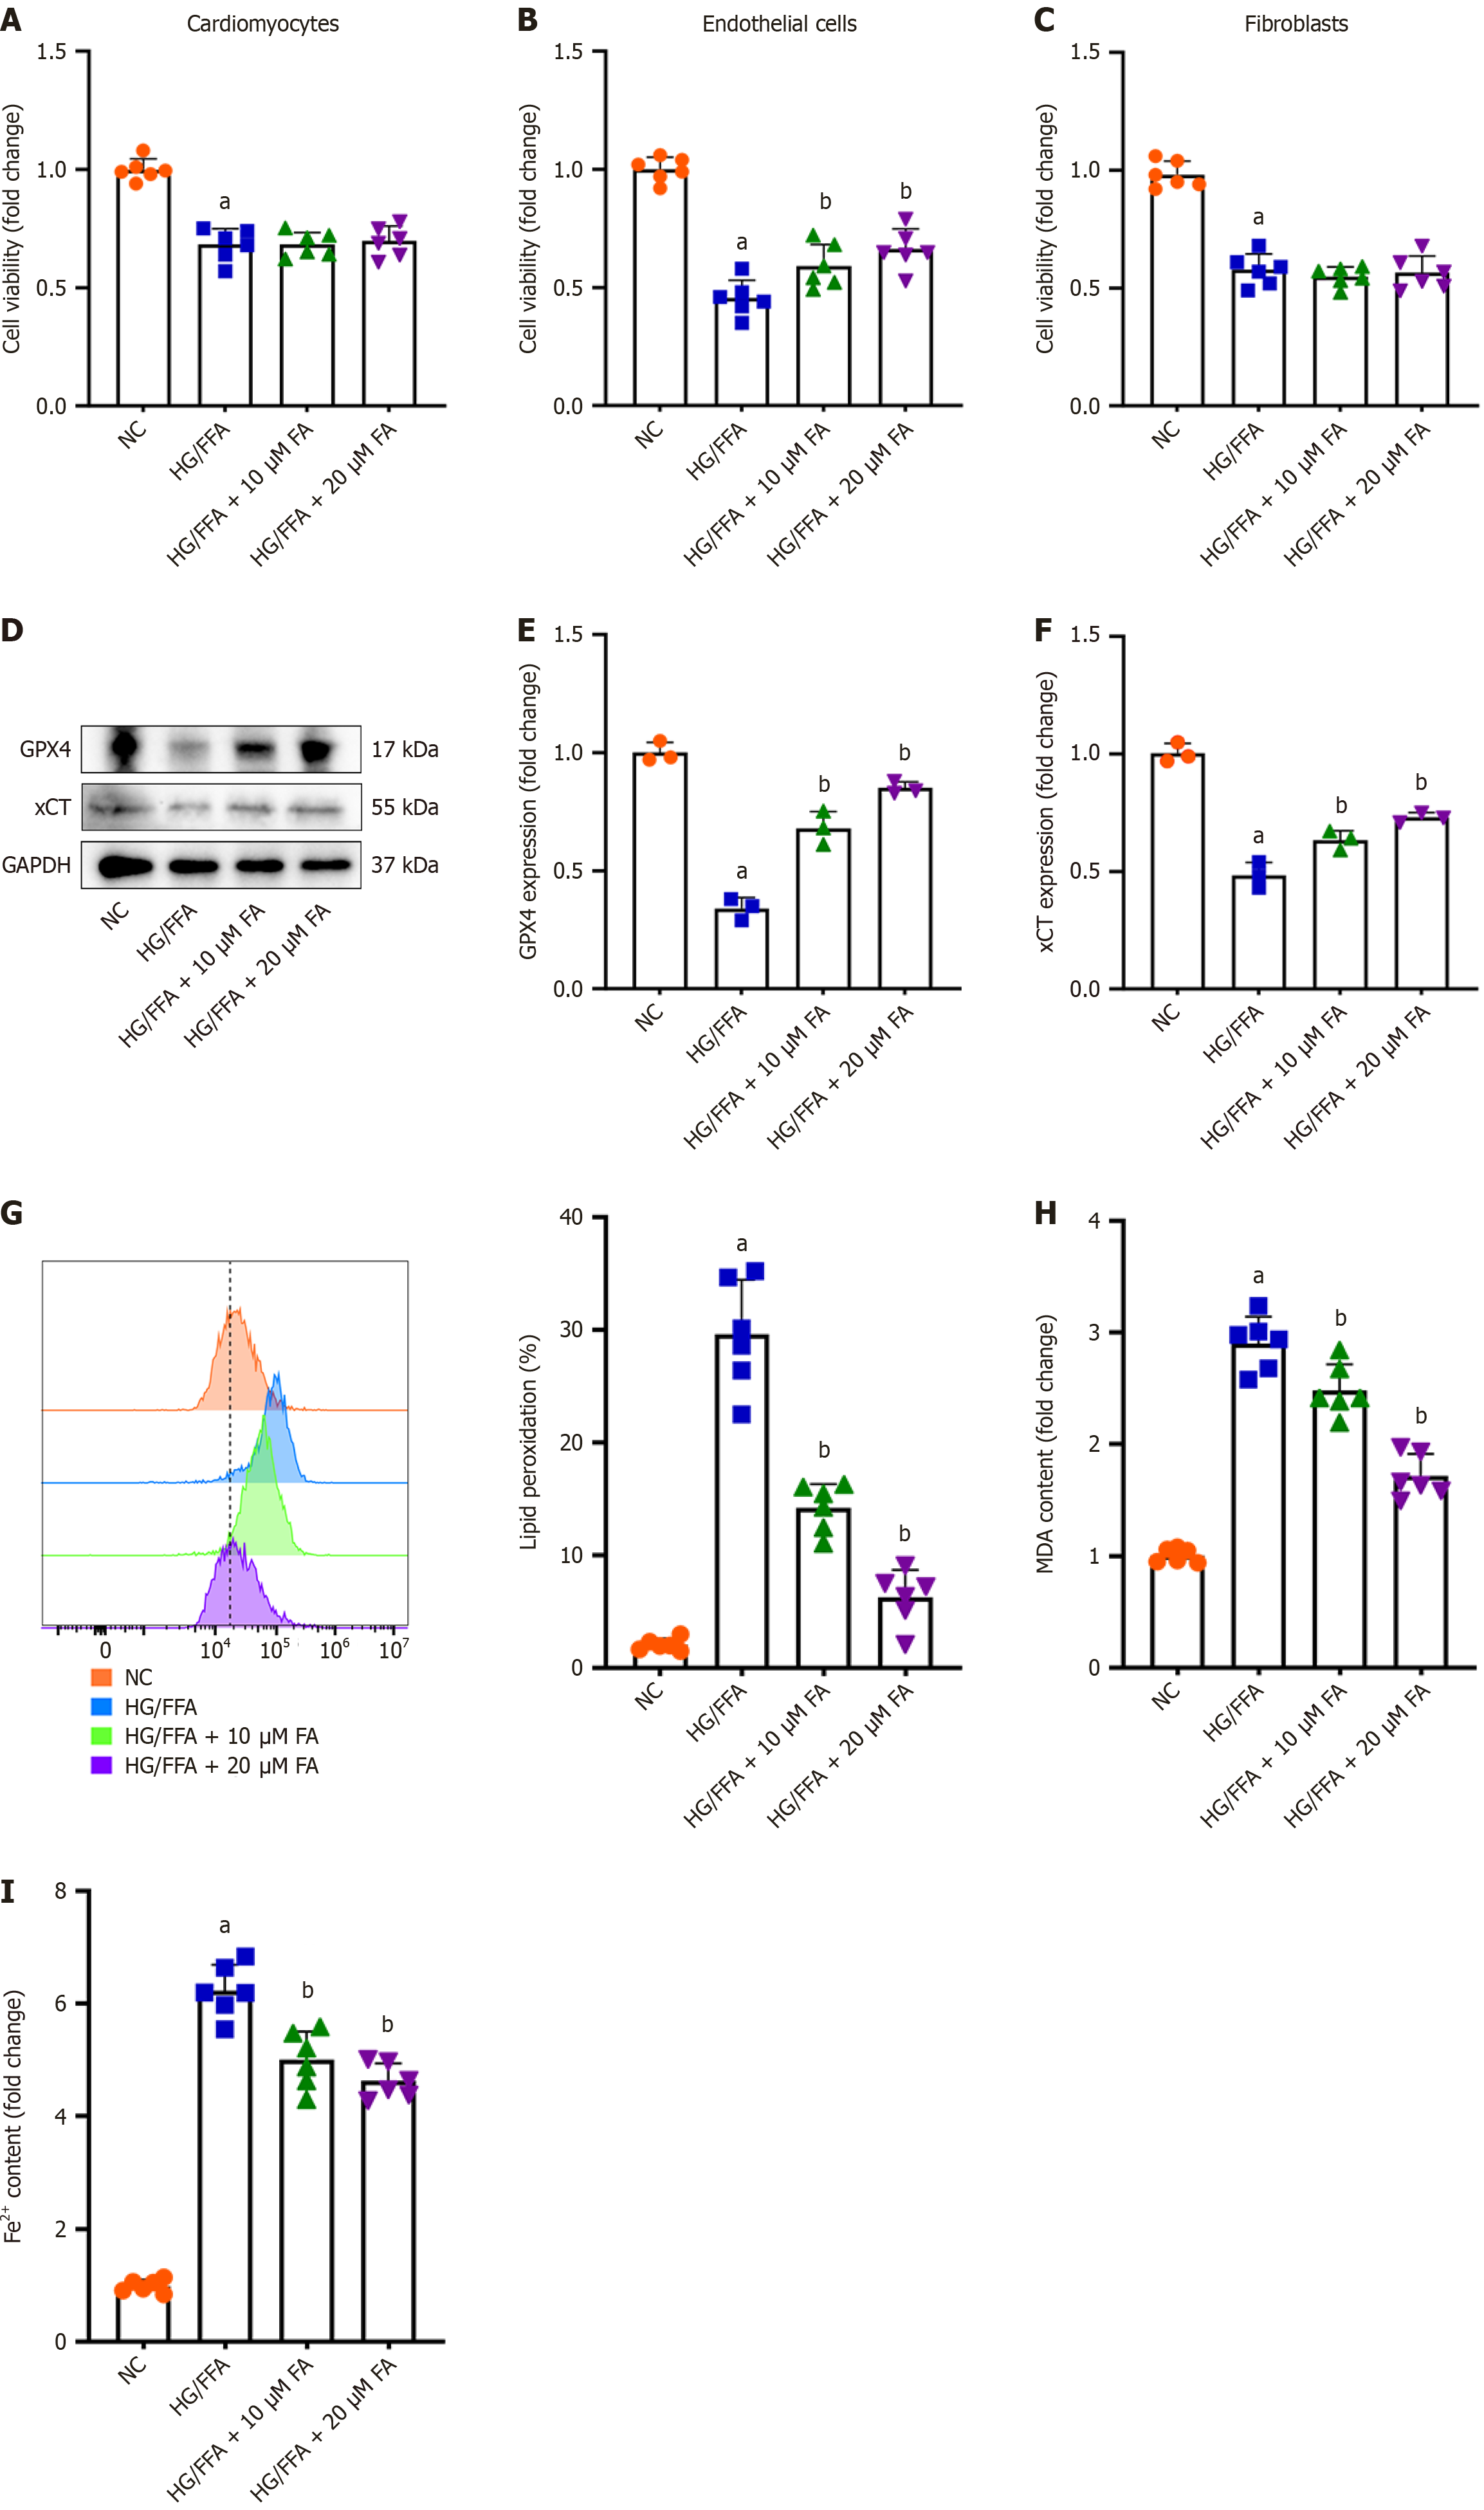
Figure 4 Farrerol treatment inhibited ferroptosis in high glucose and free fatty acid treated endothelial cells.
A-C: Cell viability was detected via cell counting kit-8 assay in cardiomyocytes, endothelial cells (ECs), and fibroblasts after indicated treatments (n = 6); D-F: Protein expression of GPX4 and xCT were detected in ECs upon high glucose and free fatty acid or different concentration of Farrerol treatment (n = 3); G: Flow cytometry is used to detect the changes in lipid peroxidation levels in ECs under different treatment conditions; H: Relative expression of malondialdehyde in the hearts from indicated groups were determined by the commercial kit (n = 6); I: The content of Fe2+ in ECs was assessed by the commercial kit (n = 6). aP < 0.05 vs NC; bP < 0.05 vs DCM. FA: Farrerol; DCM: Diabetic cardiomyopathy; HG/FFA: High glucose and free fatty acid.
- Citation: Guo Y, Yu XR, Gu HD, Wang YJ, Yang ZG, Chi JF, Zhang LP, Lin H. Farrerol ameliorates diabetic cardiomyopathy by inhibiting ferroptosis via miR-29b-3p/SIRT1 signaling pathway in endothelial cells. World J Diabetes 2025; 16(9): 109553
- URL: https://www.wjgnet.com/1948-9358/full/v16/i9/109553.htm
- DOI: https://dx.doi.org/10.4239/wjd.v16.i9.109553