
















©The Author(s) 2025.
World J Diabetes. Sep 15, 2025; 16(9): 107871
Published online Sep 15, 2025. doi: 10.4239/wjd.v16.i9.107871
Published online Sep 15, 2025. doi: 10.4239/wjd.v16.i9.107871
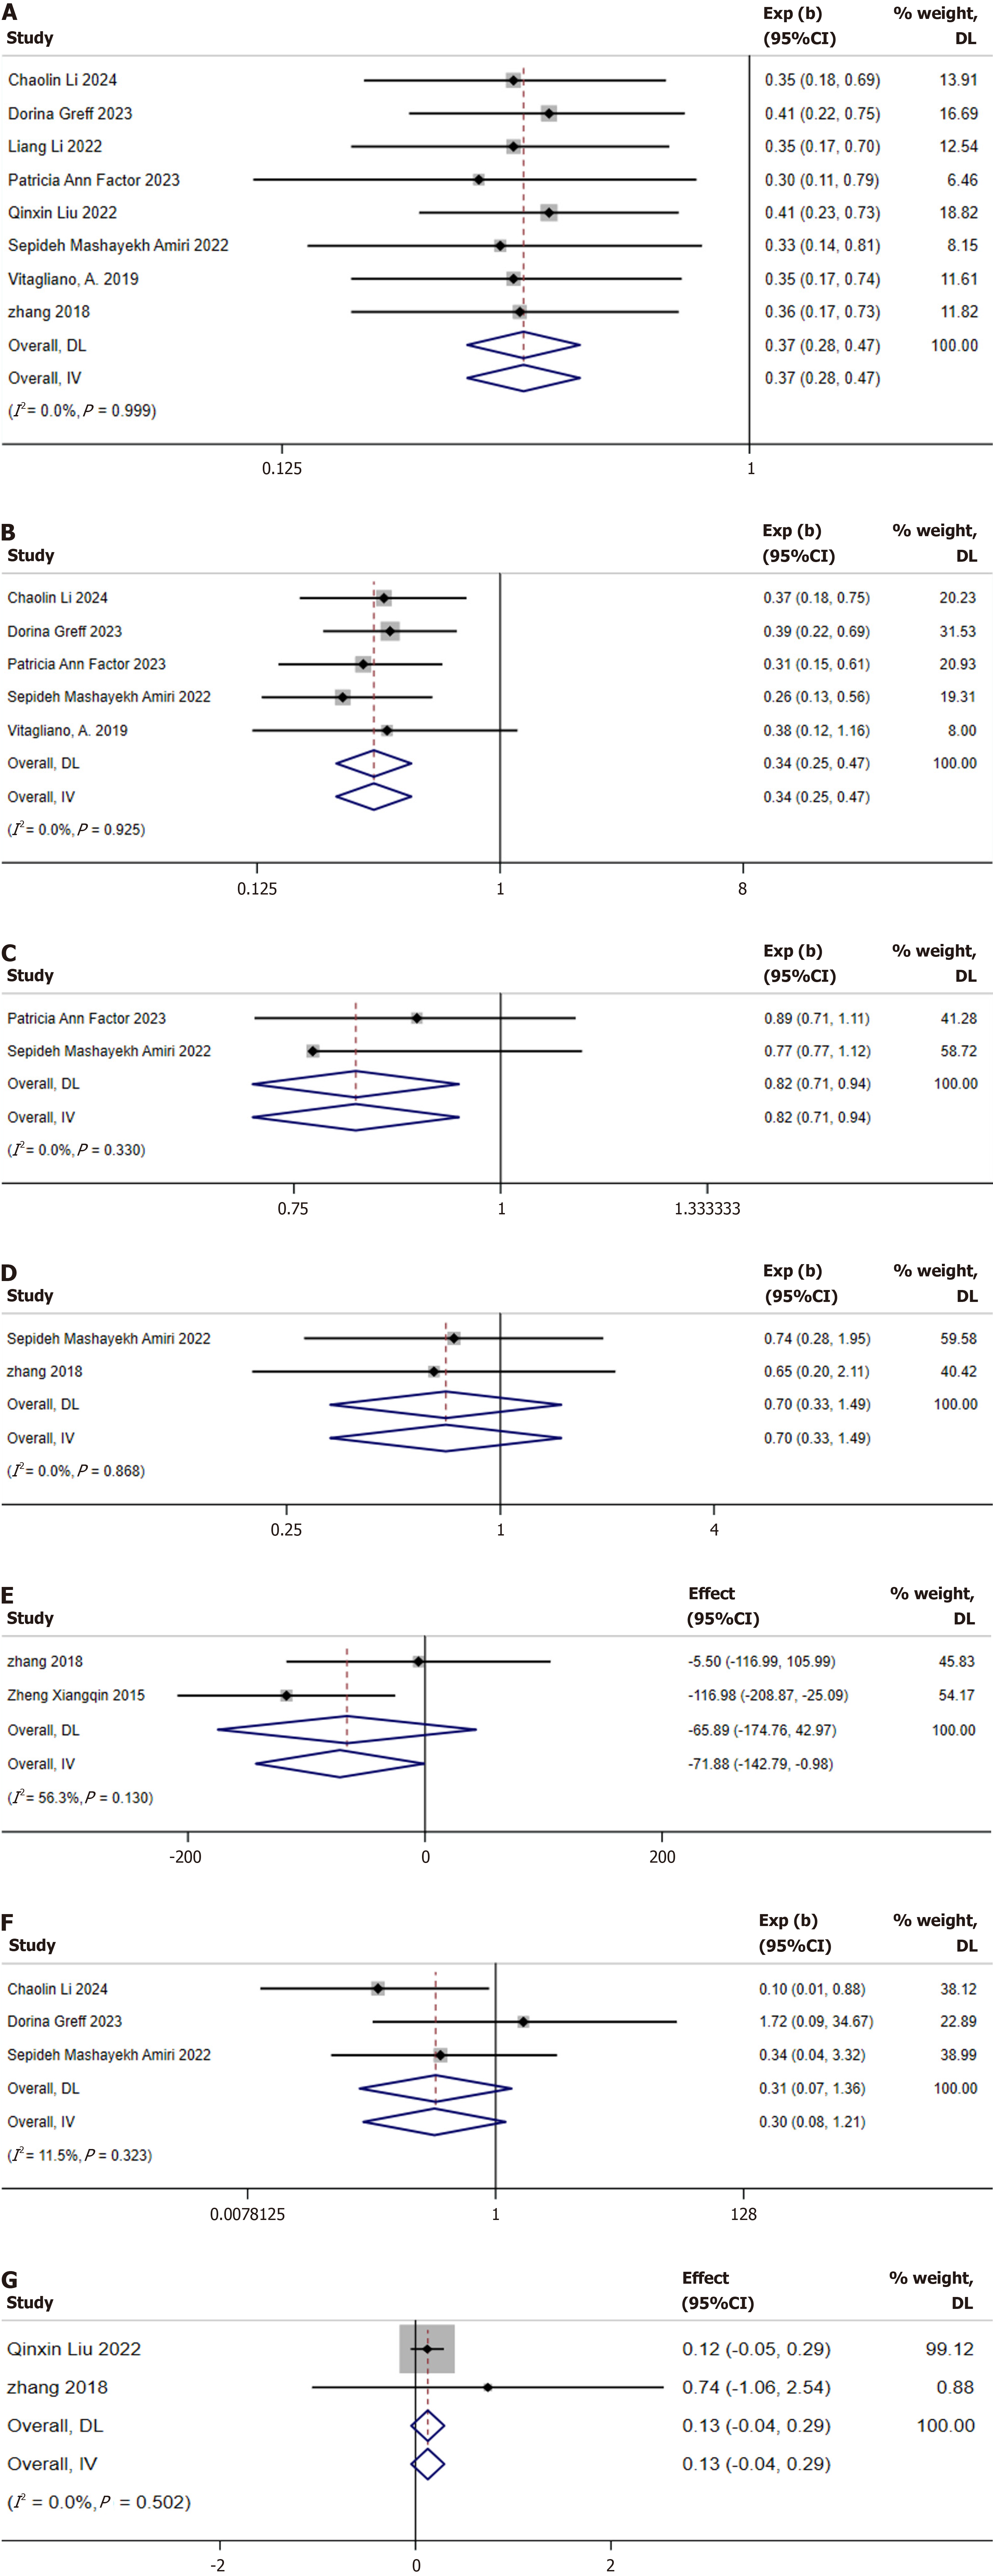
Figure 7 Forest plots of secondary outcomes.
A: Preterm birth; B: Pregnancy-induced hypertension; C: Cesarean section rate; D: Macrosomia; E: Birth weight; F: Neonatal hypoglycemia; G: Gestational age at birth. CI: Confidence interval; DL: DerSimonian-Laird.
- Citation: Wang RT, Feng YQ, Wang MY, Wei YH, Huang YJ, Guo YJ, Liu X, Lei XC, Huang KW, Huang H. Efficacy of inositol supplementation in the prevention and treatment of gestational diabetes mellitus: A meta-analysis. World J Diabetes 2025; 16(9): 107871
- URL: https://www.wjgnet.com/1948-9358/full/v16/i9/107871.htm
- DOI: https://dx.doi.org/10.4239/wjd.v16.i9.107871