















©The Author(s) 2025.
World J Diabetes. Sep 15, 2025; 16(9): 106002
Published online Sep 15, 2025. doi: 10.4239/wjd.v16.i9.106002
Published online Sep 15, 2025. doi: 10.4239/wjd.v16.i9.106002
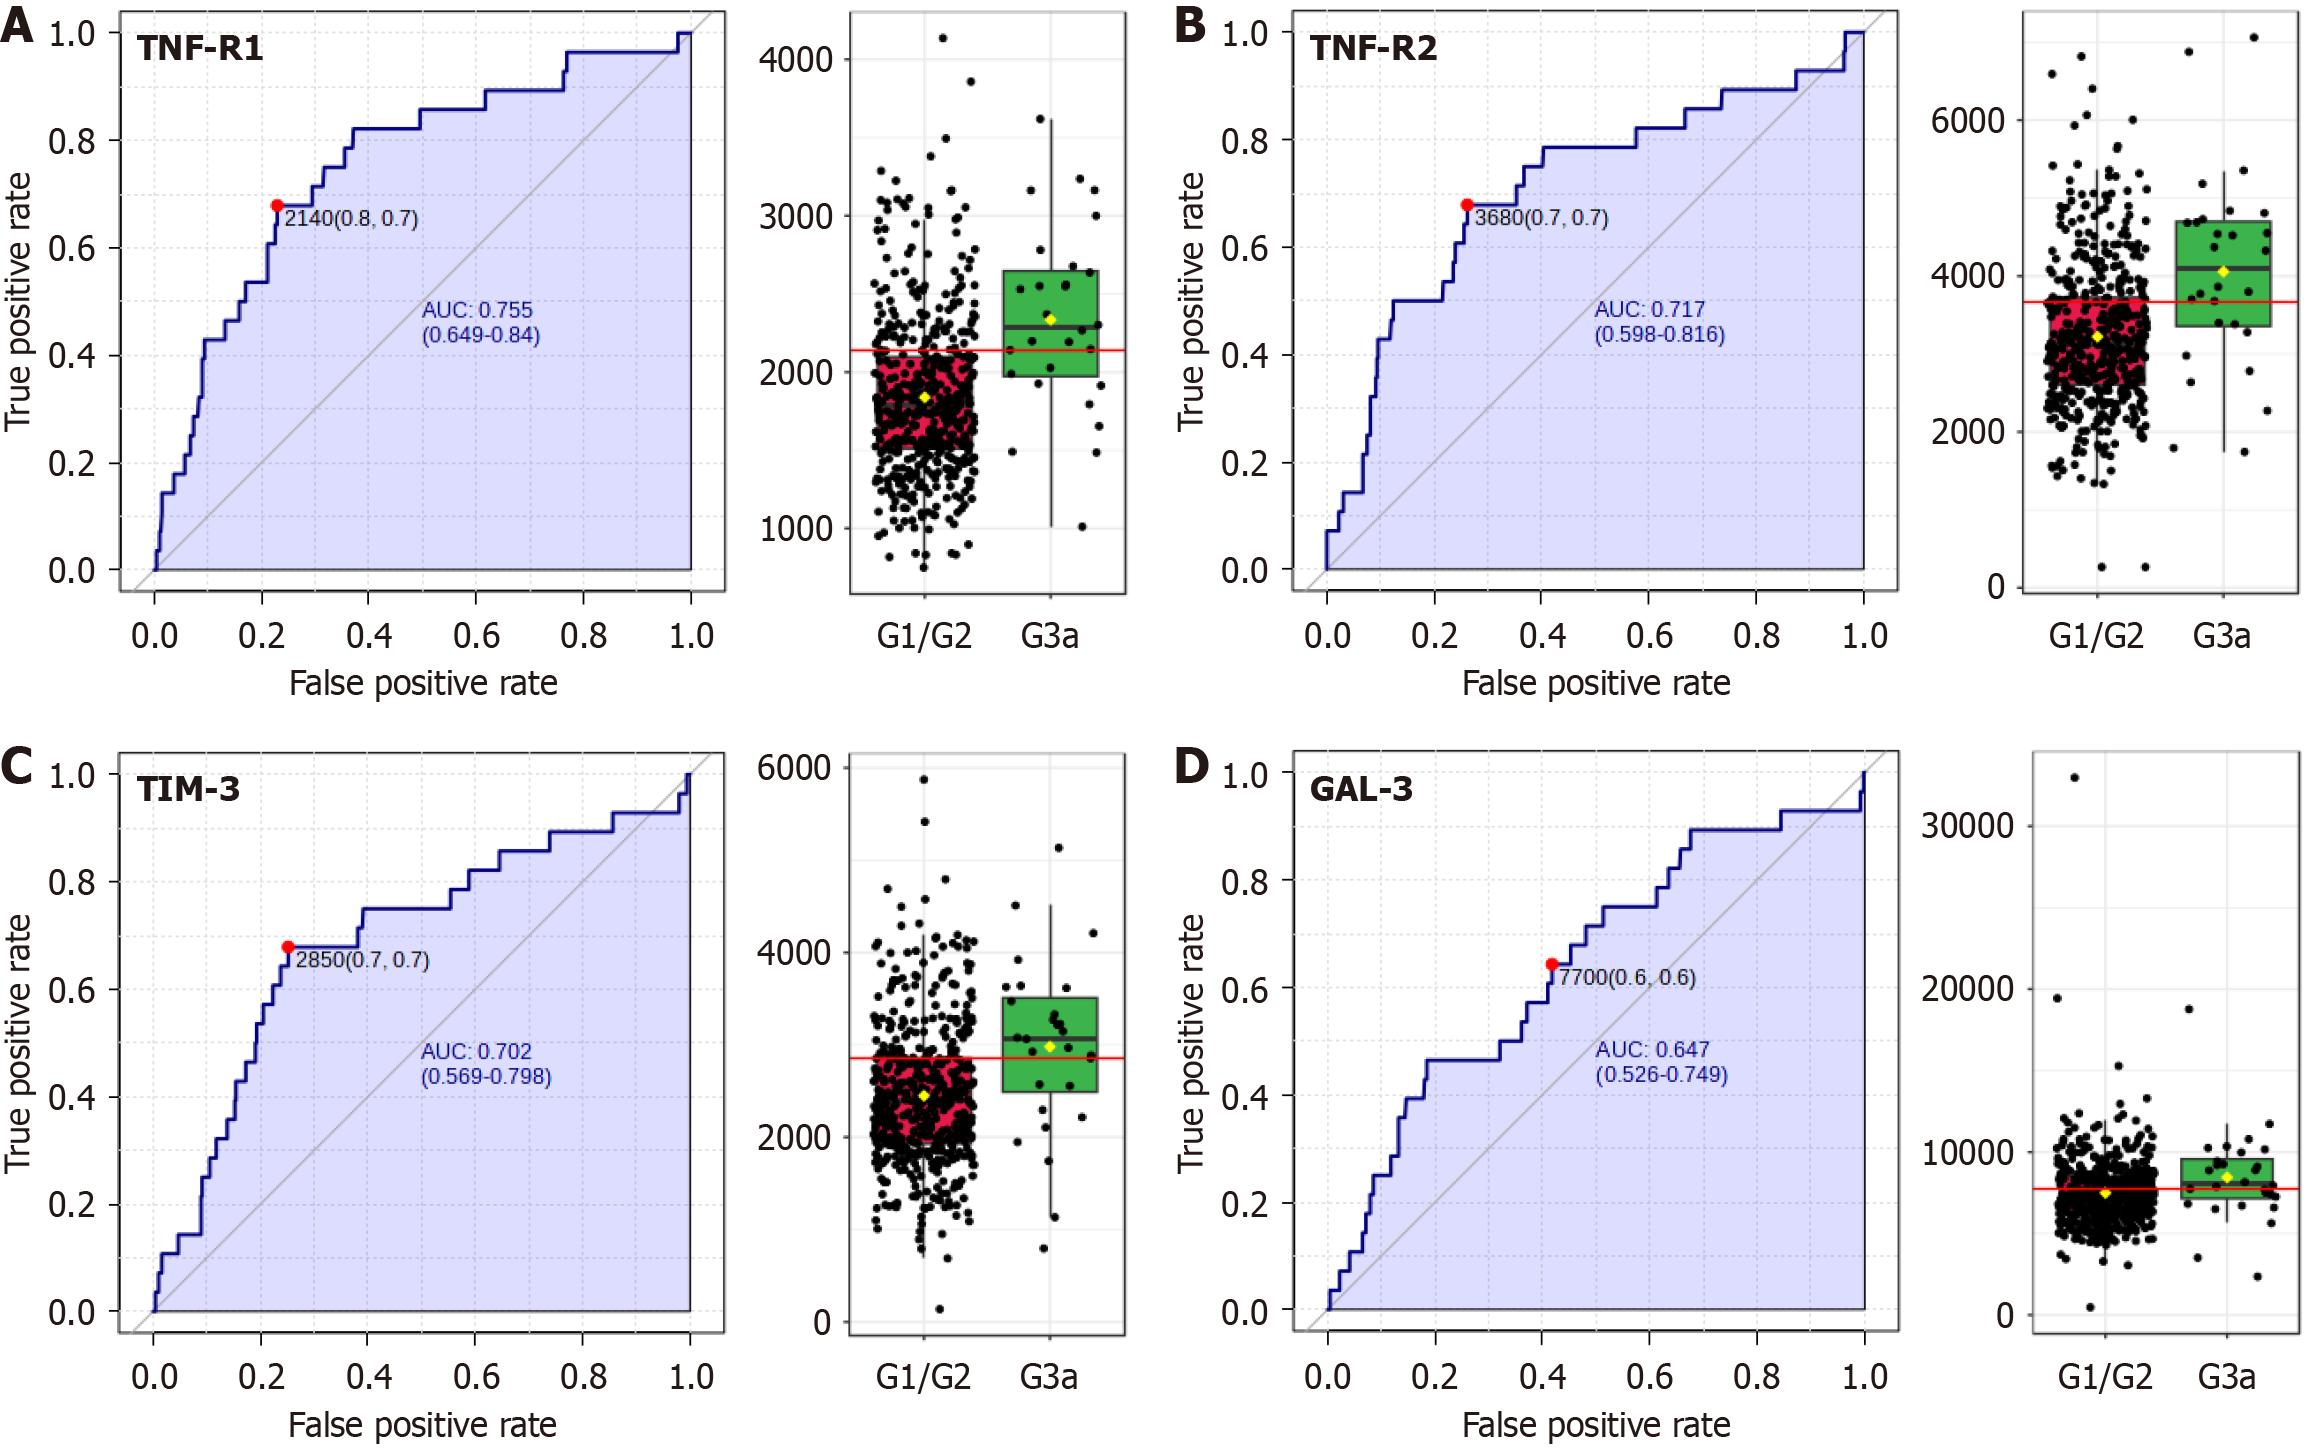
Figure 3 Receiver operating characteristic analysis.
A: Interleukin 6; B: T-cell immunoglobulin and mucin domain 3/HAVCR2; C: Tumor necrosis factor receptor 2; D: Galectin-3. As biomarkers of hypofiltration-3, displaying their performance in distinguishing between prediabetic individuals with estimated glomerular filtration rate (eGFR) < 60 (G3a) and those with eGFR > 60 (G1/G2). The area under the curve values and optimal cut-off points for each biomarker are clearly indicated. TIM-3: T-cell immunoglobulin and mucin domain 3; TNF-R2: Tumor necrosis factor receptor 2; GAL-3: Galectin-3; TNF-R1: Tumor necrosis factor receptor 1.
- Citation: Mas-Fontao S, Civantos E, Boukichou-Abdelkader N, Moreno JA, Gomez-Guerrero C, Gálvez MIL, Tuomilehto J, Lind M, Gabriel R, Egido J. Increased tumor necrosis factor-receptor superfamily plasma levels are associated with early renal or retinal involvement in intermediate hyperglycemia. World J Diabetes 2025; 16(9): 106002
- URL: https://www.wjgnet.com/1948-9358/full/v16/i9/106002.htm
- DOI: https://dx.doi.org/10.4239/wjd.v16.i9.106002