















©The Author(s) 2025.
World J Diabetes. Sep 15, 2025; 16(9): 106002
Published online Sep 15, 2025. doi: 10.4239/wjd.v16.i9.106002
Published online Sep 15, 2025. doi: 10.4239/wjd.v16.i9.106002
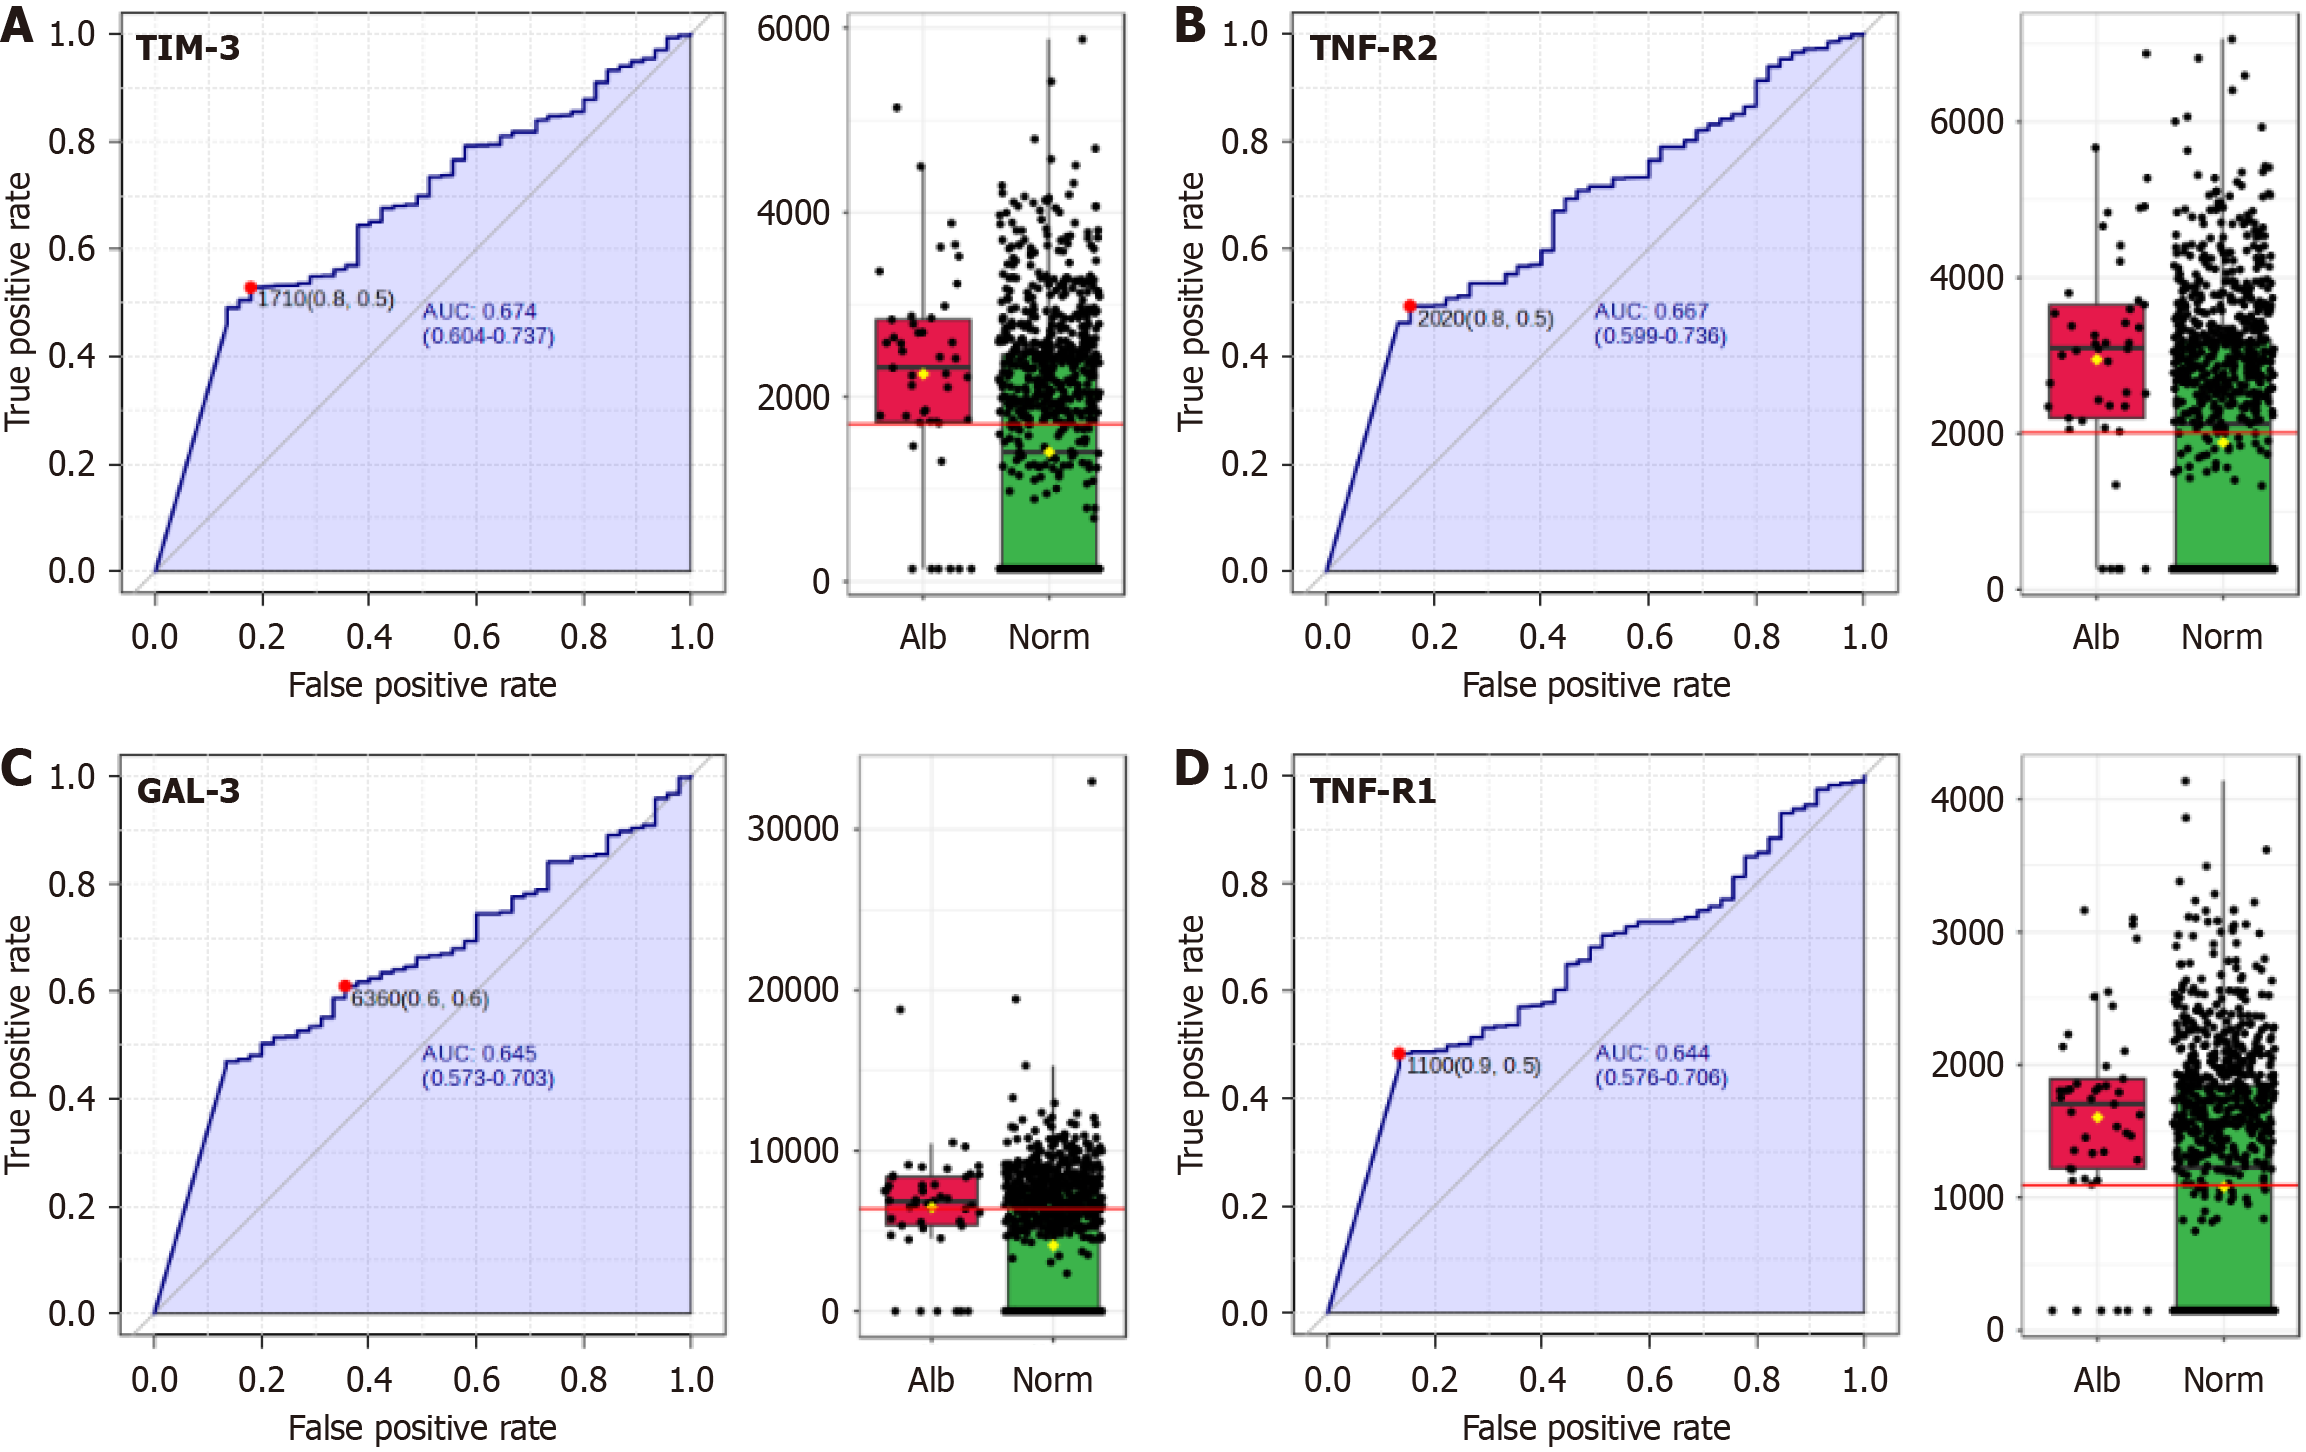
Figure 2 Receiver operating characteristic analysis for predicting as biomarkers of albuminuria showing the performance of each marker in distinguishing between albuminuria (red) vs normal-albuminuria (green).
A: T-cell immunoglobulin and mucin domain 3/HAVCR2; B: Tumor necrosis factor receptor 2; C: Galectin-3; D: Tumor necrosis factor receptor 1 with the area under the curve values. Box plots on the right, displaying the distribution of values for each marker across different groups (albuminuria vs normal) with the red line showing the optimal cut-off value for each of them. TIM-3: T-cell immunoglobulin and mucin domain 3; TNF-R2: Tumor necrosis factor receptor 2; GAL-3: Galectin-3; TNF-R1: Tumor necrosis factor receptor 1; Alb: Albuminuria; Norm: Normal.
- Citation: Mas-Fontao S, Civantos E, Boukichou-Abdelkader N, Moreno JA, Gomez-Guerrero C, Gálvez MIL, Tuomilehto J, Lind M, Gabriel R, Egido J. Increased tumor necrosis factor-receptor superfamily plasma levels are associated with early renal or retinal involvement in intermediate hyperglycemia. World J Diabetes 2025; 16(9): 106002
- URL: https://www.wjgnet.com/1948-9358/full/v16/i9/106002.htm
- DOI: https://dx.doi.org/10.4239/wjd.v16.i9.106002