
















©The Author(s) 2025.
World J Diabetes. Aug 15, 2025; 16(8): 108839
Published online Aug 15, 2025. doi: 10.4239/wjd.v16.i8.108839
Published online Aug 15, 2025. doi: 10.4239/wjd.v16.i8.108839
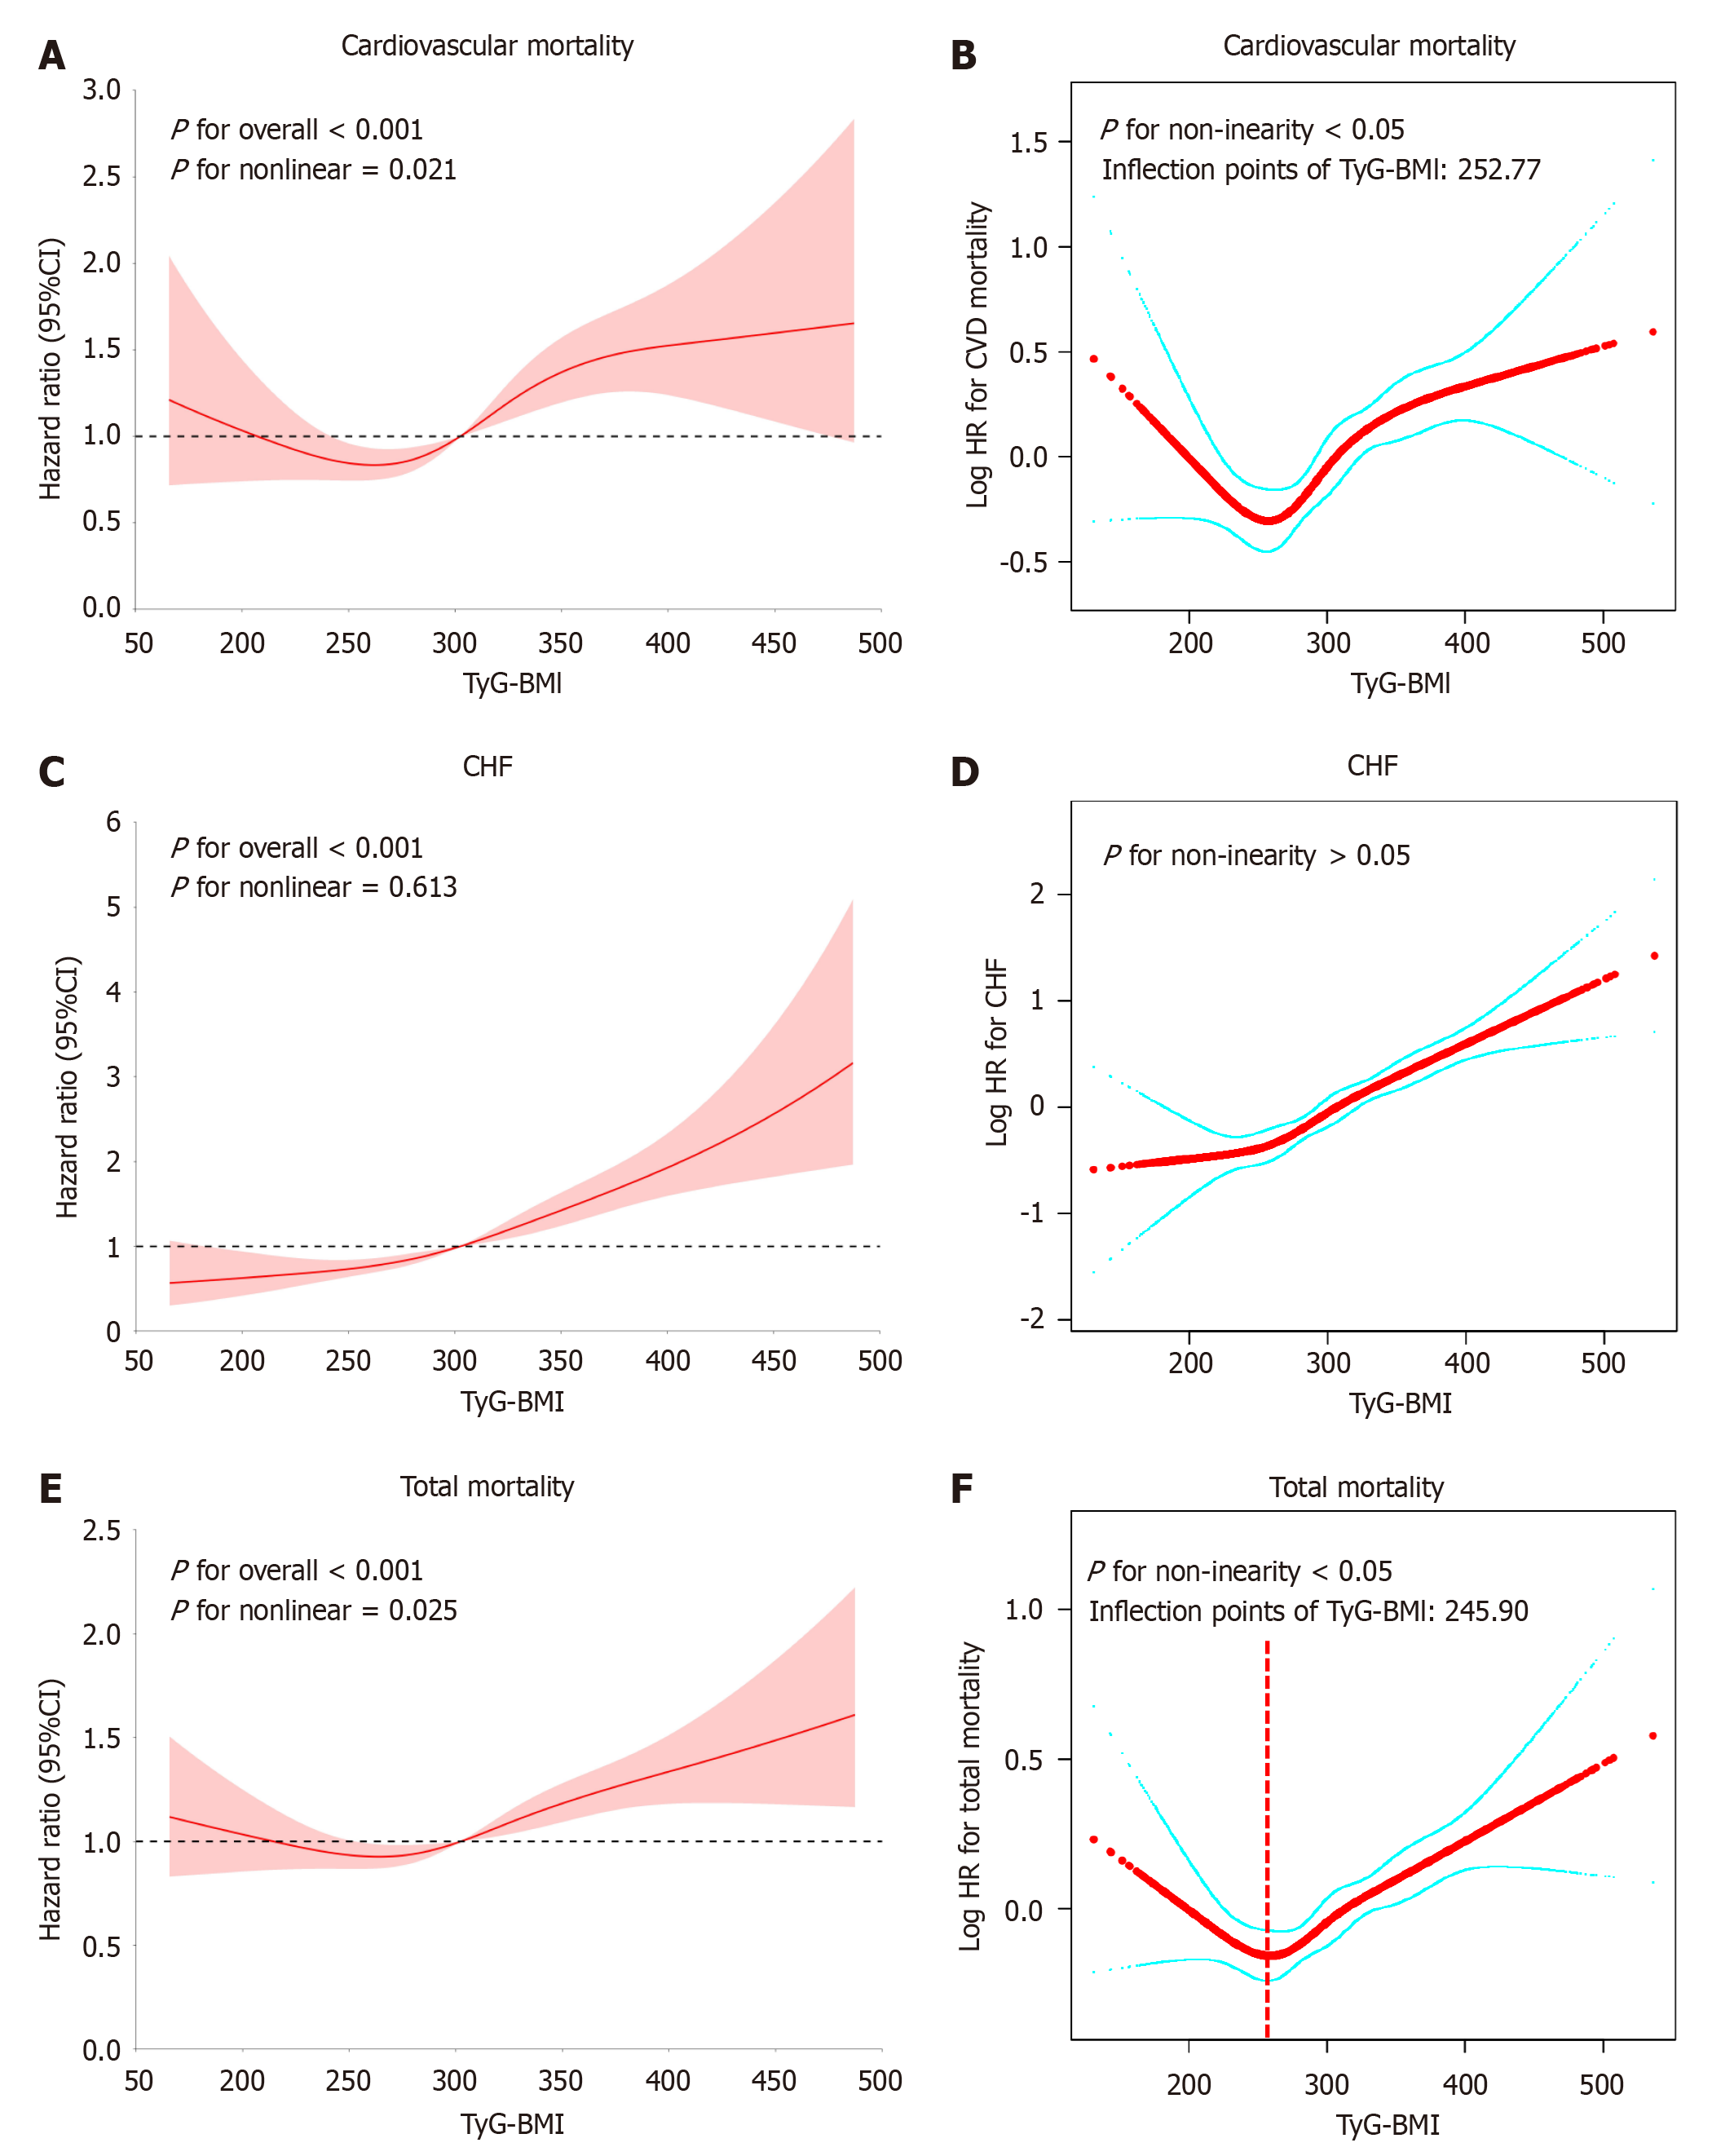
Figure 3 Restricted cubic spline and smooth curve fitting analyses were performed to assess the relationship between triglyceride glucose-body mass index and the risk of cardiovascular outcomes and total mortality.
A and B: Cardiovascular mortality; C and D: Congestive heart failure; E and F: Total mortality. The hazard ratios shown are adjusted for Model 3, including sex, race, age, education, history of cardiovascular disease, previous hypertension, previous hyperlipidemia, diastolic blood pressure, systolic blood pressure, duration of diabetes, proteinuria, heart failure, smoking status, glycated hemoglobin, total cholesterol, low density lipoprotein-cholesterol, estimated glomerular filtration rate, calcium channel blocker, beta-blockers, biguanides, thiazolidinediones, insulin, aspirin, cholesterol absorption inhibitors. TyG: Triglyceride glucose; BMI: Body mass index; CHF: Congestive heart failure; CVD: Cardiovascular disease.
- Citation: Liu MJ, Xiang SM, Hu XQ. Triglyceride glucose-body mass index is associated with cardiovascular outcomes and overall mortality in type-2 diabetes mellitus patients. World J Diabetes 2025; 16(8): 108839
- URL: https://www.wjgnet.com/1948-9358/full/v16/i8/108839.htm
- DOI: https://dx.doi.org/10.4239/wjd.v16.i8.108839