Copyright
©The Author(s) 2025.
World J Diabetes. Aug 15, 2025; 16(8): 106833
Published online Aug 15, 2025. doi: 10.4239/wjd.v16.i8.106833
Published online Aug 15, 2025. doi: 10.4239/wjd.v16.i8.106833
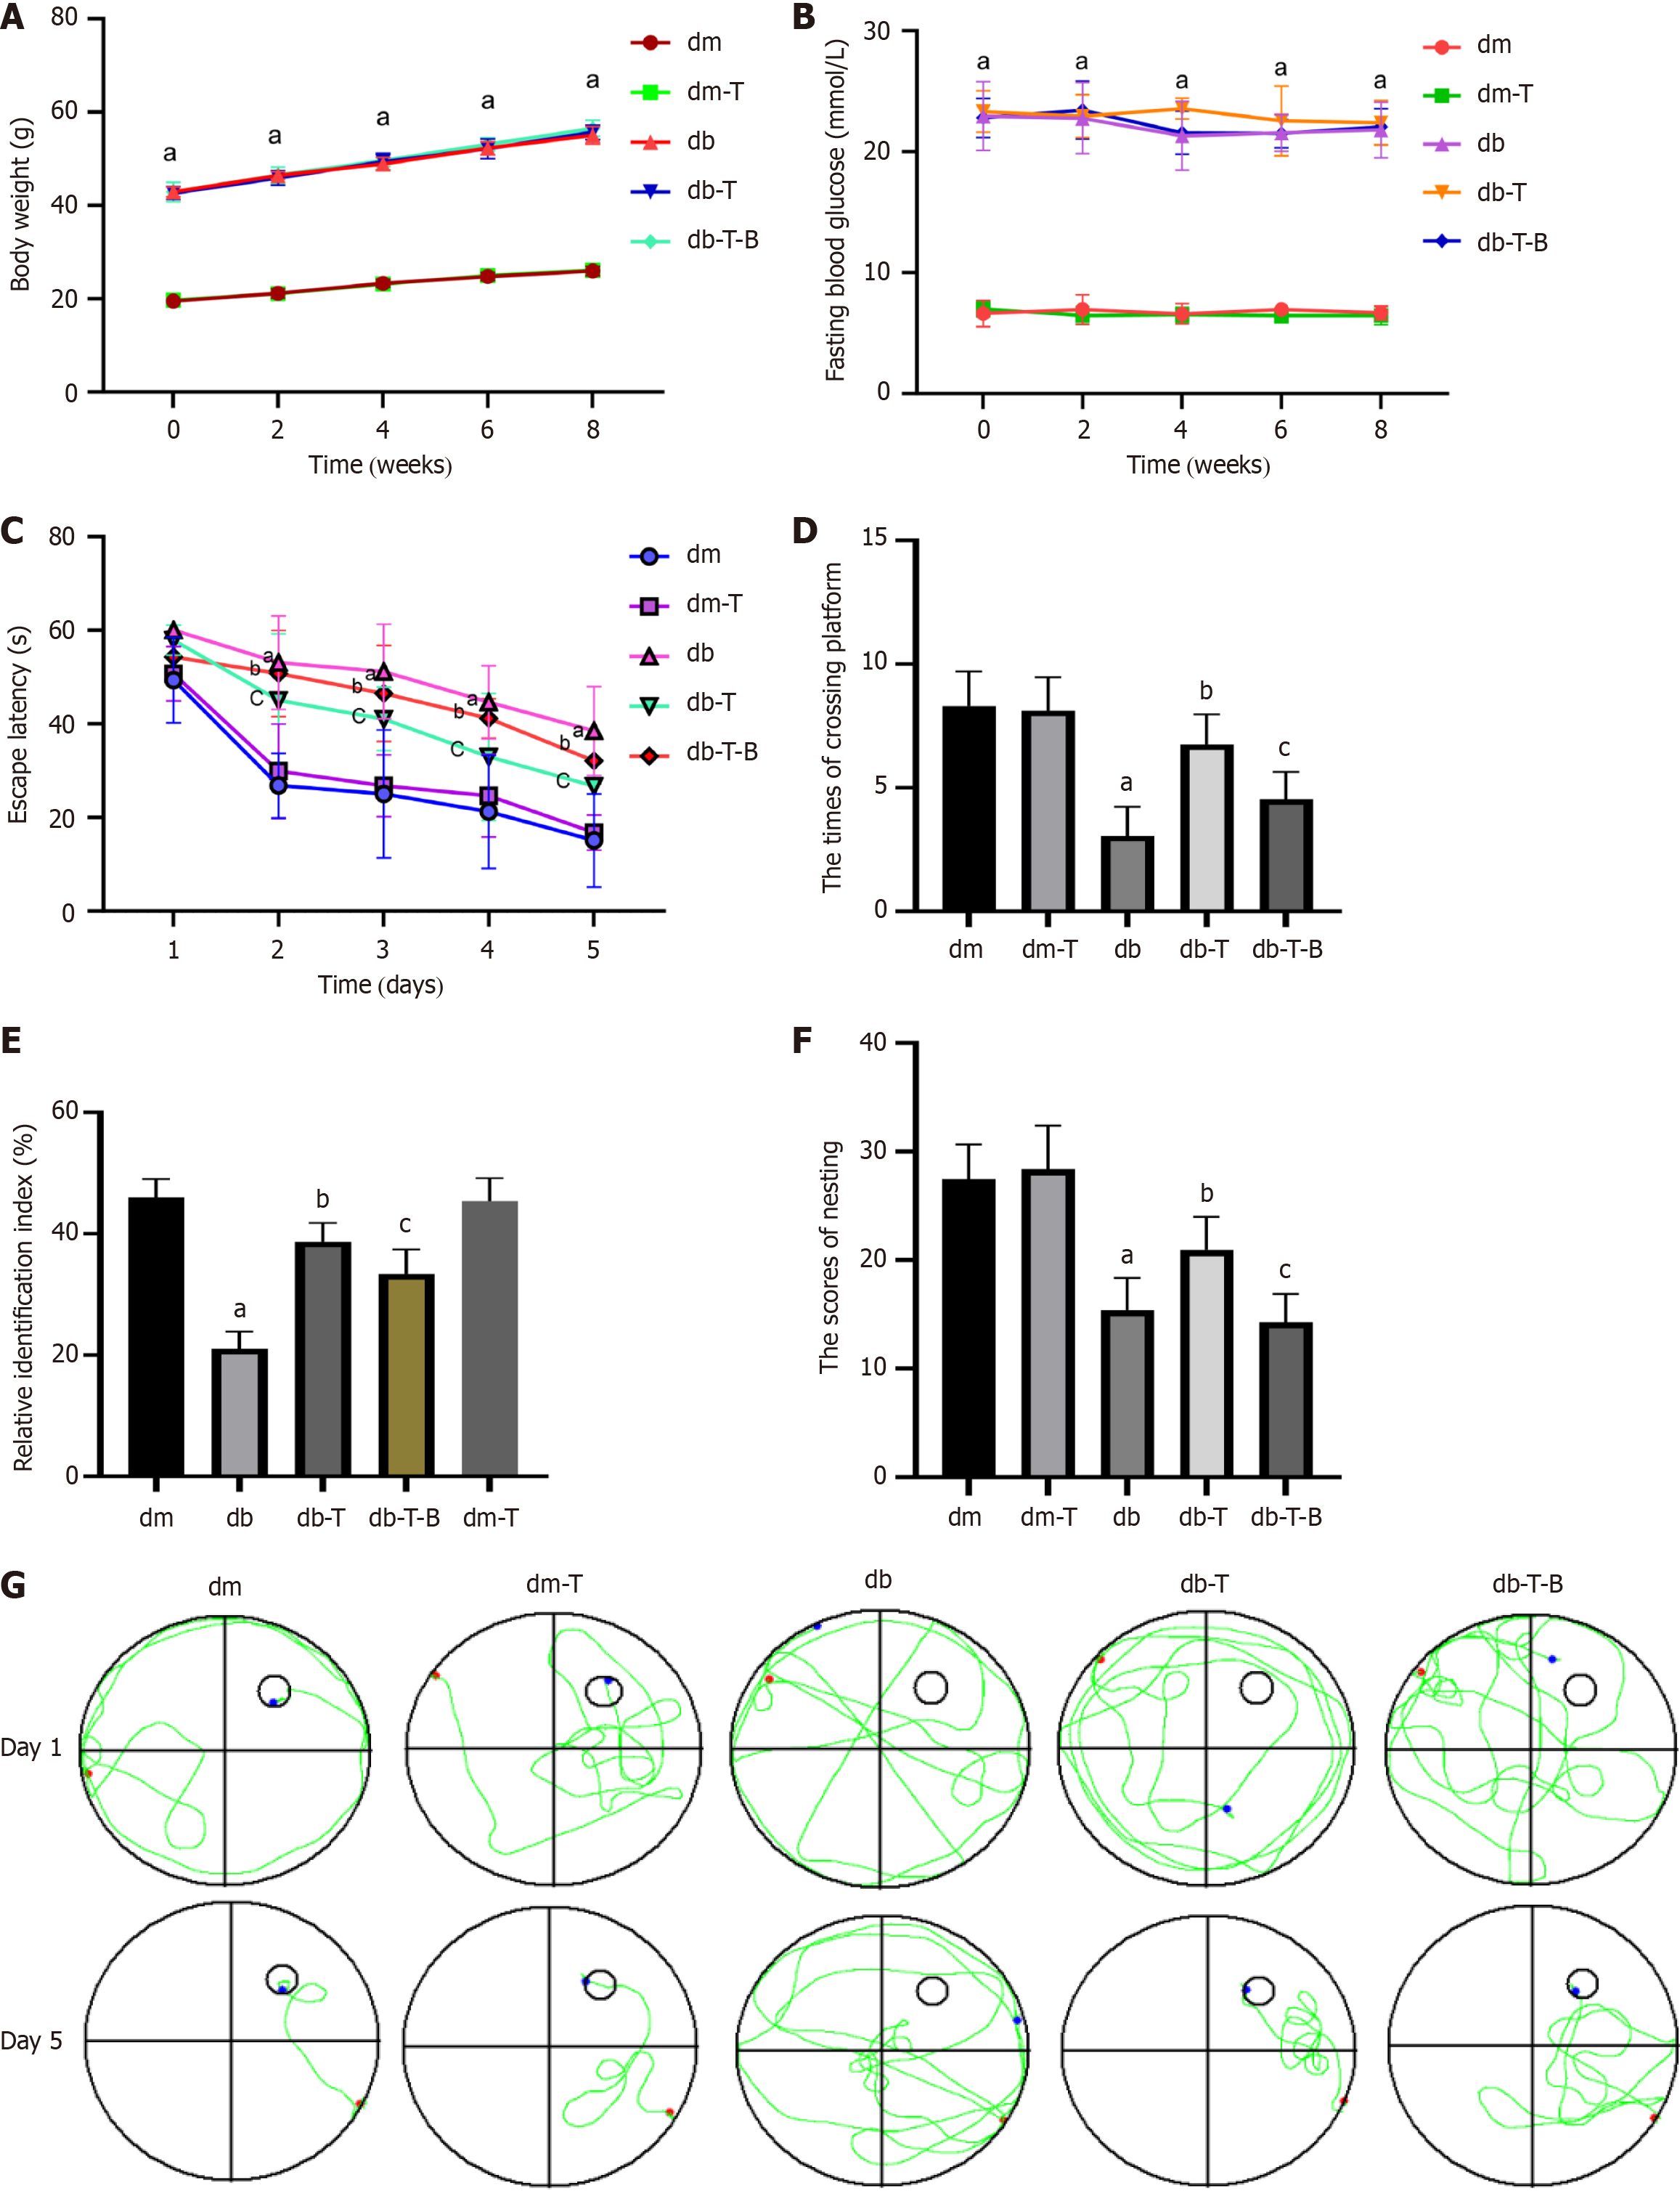
Figure 2 The db/db mice exhibit cognitive dysfunction at 17 weeks of age.
A: The body weight (n = 8 mice per group); B: The fasting glucose level (n = 8 mice per group); the animals’ cognitive functions were assessed by the Morris water-maze test, novel object recognition and Nesting test as described in “materials and methods” (n = 8 mice per group); C: Escape latency (s); D: The times of crossing platform within 60 seconds in spatial probe test; E: Relative identification index; F: The scores of nesting; G: Swimming trajectories of the mice in exploration experiment. aP < 0.05, compared with dm group; bP < 0.05, compared with db group; cP < 0.05, compared with the db-T group. Data presented as mean ± SEM. dm: Control group; dm-T: Control + troxerutin group; db: Diabetes group; db-T: Diabetes + troxerutin group; db-T-B: Diabetes + troxerutin + bradykinin group.
- Citation: Li J, Gao M, Wang JX, Li HY, Wang P, Yuan F, Liu AJ, Zhang SY. Troxerutin improves diabetic cognitive dysfunction by inhibiting mitochondrial fission mediated by transient receptor potential melastatin 7/calcineurin/dynamin-related protein 1ser637. World J Diabetes 2025; 16(8): 106833
- URL: https://www.wjgnet.com/1948-9358/full/v16/i8/106833.htm
- DOI: https://dx.doi.org/10.4239/wjd.v16.i8.106833


