Copyright
©The Author(s) 2025.
World J Diabetes. Aug 15, 2025; 16(8): 105228
Published online Aug 15, 2025. doi: 10.4239/wjd.v16.i8.105228
Published online Aug 15, 2025. doi: 10.4239/wjd.v16.i8.105228
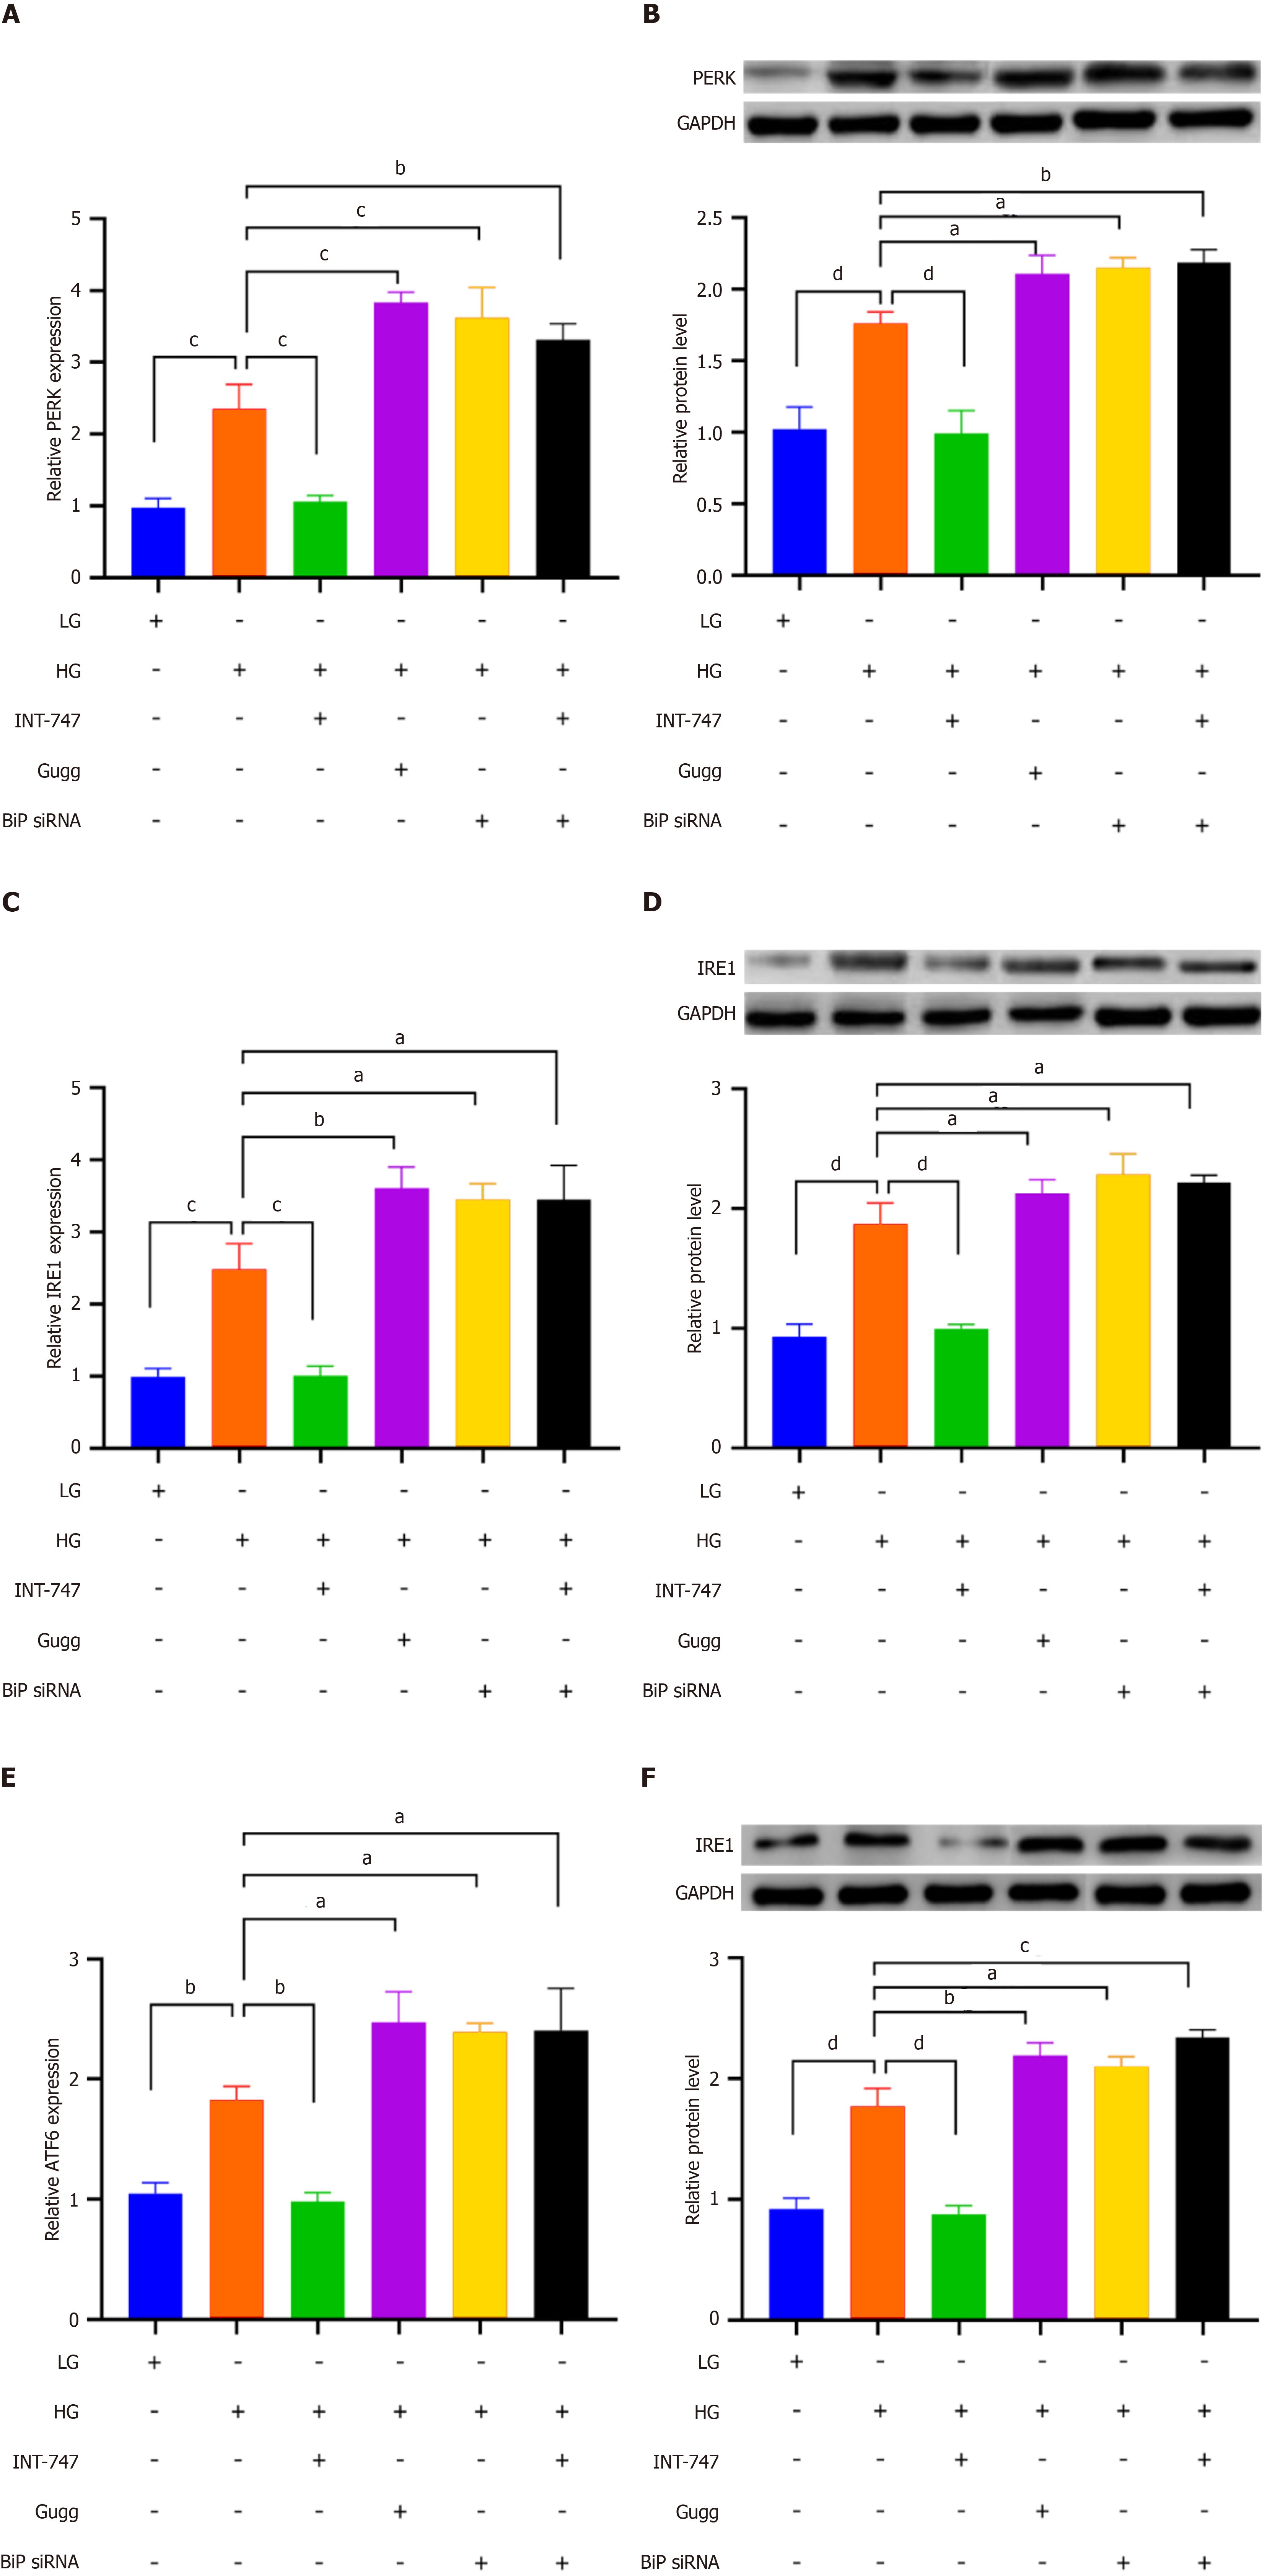
Figure 3 Farnesoid X receptor regulates the effect of binding immunoglobulin protein on downstream endoplasmic reticulum stress related signaling molecules.
A: Bar chart showing the expression levels of protein kinase R-like endoplasmic reticulum kinase (PERK) message RNA (mRNA) in different treatment groups, detected by quantitative real-time polymerase chain reaction (qRT-PCR); B: Western blot (WB) displays the expression levels of PERK protein in different treatment groups, and the bar chart shows the grayscale values of WB bands; C: Bar chart showing the expression levels of inositol-requiring enzyme 1 (IRE1) mRNA in different treatment groups, detected by qRT-PCR; D: WB displays the expression levels of the IRE1 protein in different treatment groups, with the bar chart showing the grayscale values of WB bands; E: Bar chart showing the expression levels of activating transcription factor 6 (ATF6) mRNA in different treatment groups, detected by qRT-PCR; F: WB displays the expression levels of the ATF6 protein in different treatment groups, with the bar chart showing the grayscale values of WB bands. aP < 0.05. bP < 0.01. cP < 0.001. dP < 0.0001. HG: High glucose; LG: Low glucose; INT-747: Obeticholic acid; BiP: Binding immunoglobulin protein; Gugg: Guggulsterones; siRNA: Small interfering RNA; GAPDH: Glyceraldehyde-3-phosphate dehydrogenase; PERK: Protein kinase R-like endoplasmic reticulum kinase; IRE1: Inositol-requiring enzyme 1; ATF6: Activating transcription factor 6.
- Citation: Tang JY, Chong YJ, Yang L, Li X, Yang Y, Li JC, Mu J. Activation of farnesoid X receptor upregulates binding immunoglobulin protein expression and alleviates diabetic nephropathy. World J Diabetes 2025; 16(8): 105228
- URL: https://www.wjgnet.com/1948-9358/full/v16/i8/105228.htm
- DOI: https://dx.doi.org/10.4239/wjd.v16.i8.105228


