Copyright
©The Author(s) 2025.
World J Diabetes. Aug 15, 2025; 16(8): 104879
Published online Aug 15, 2025. doi: 10.4239/wjd.v16.i8.104879
Published online Aug 15, 2025. doi: 10.4239/wjd.v16.i8.104879
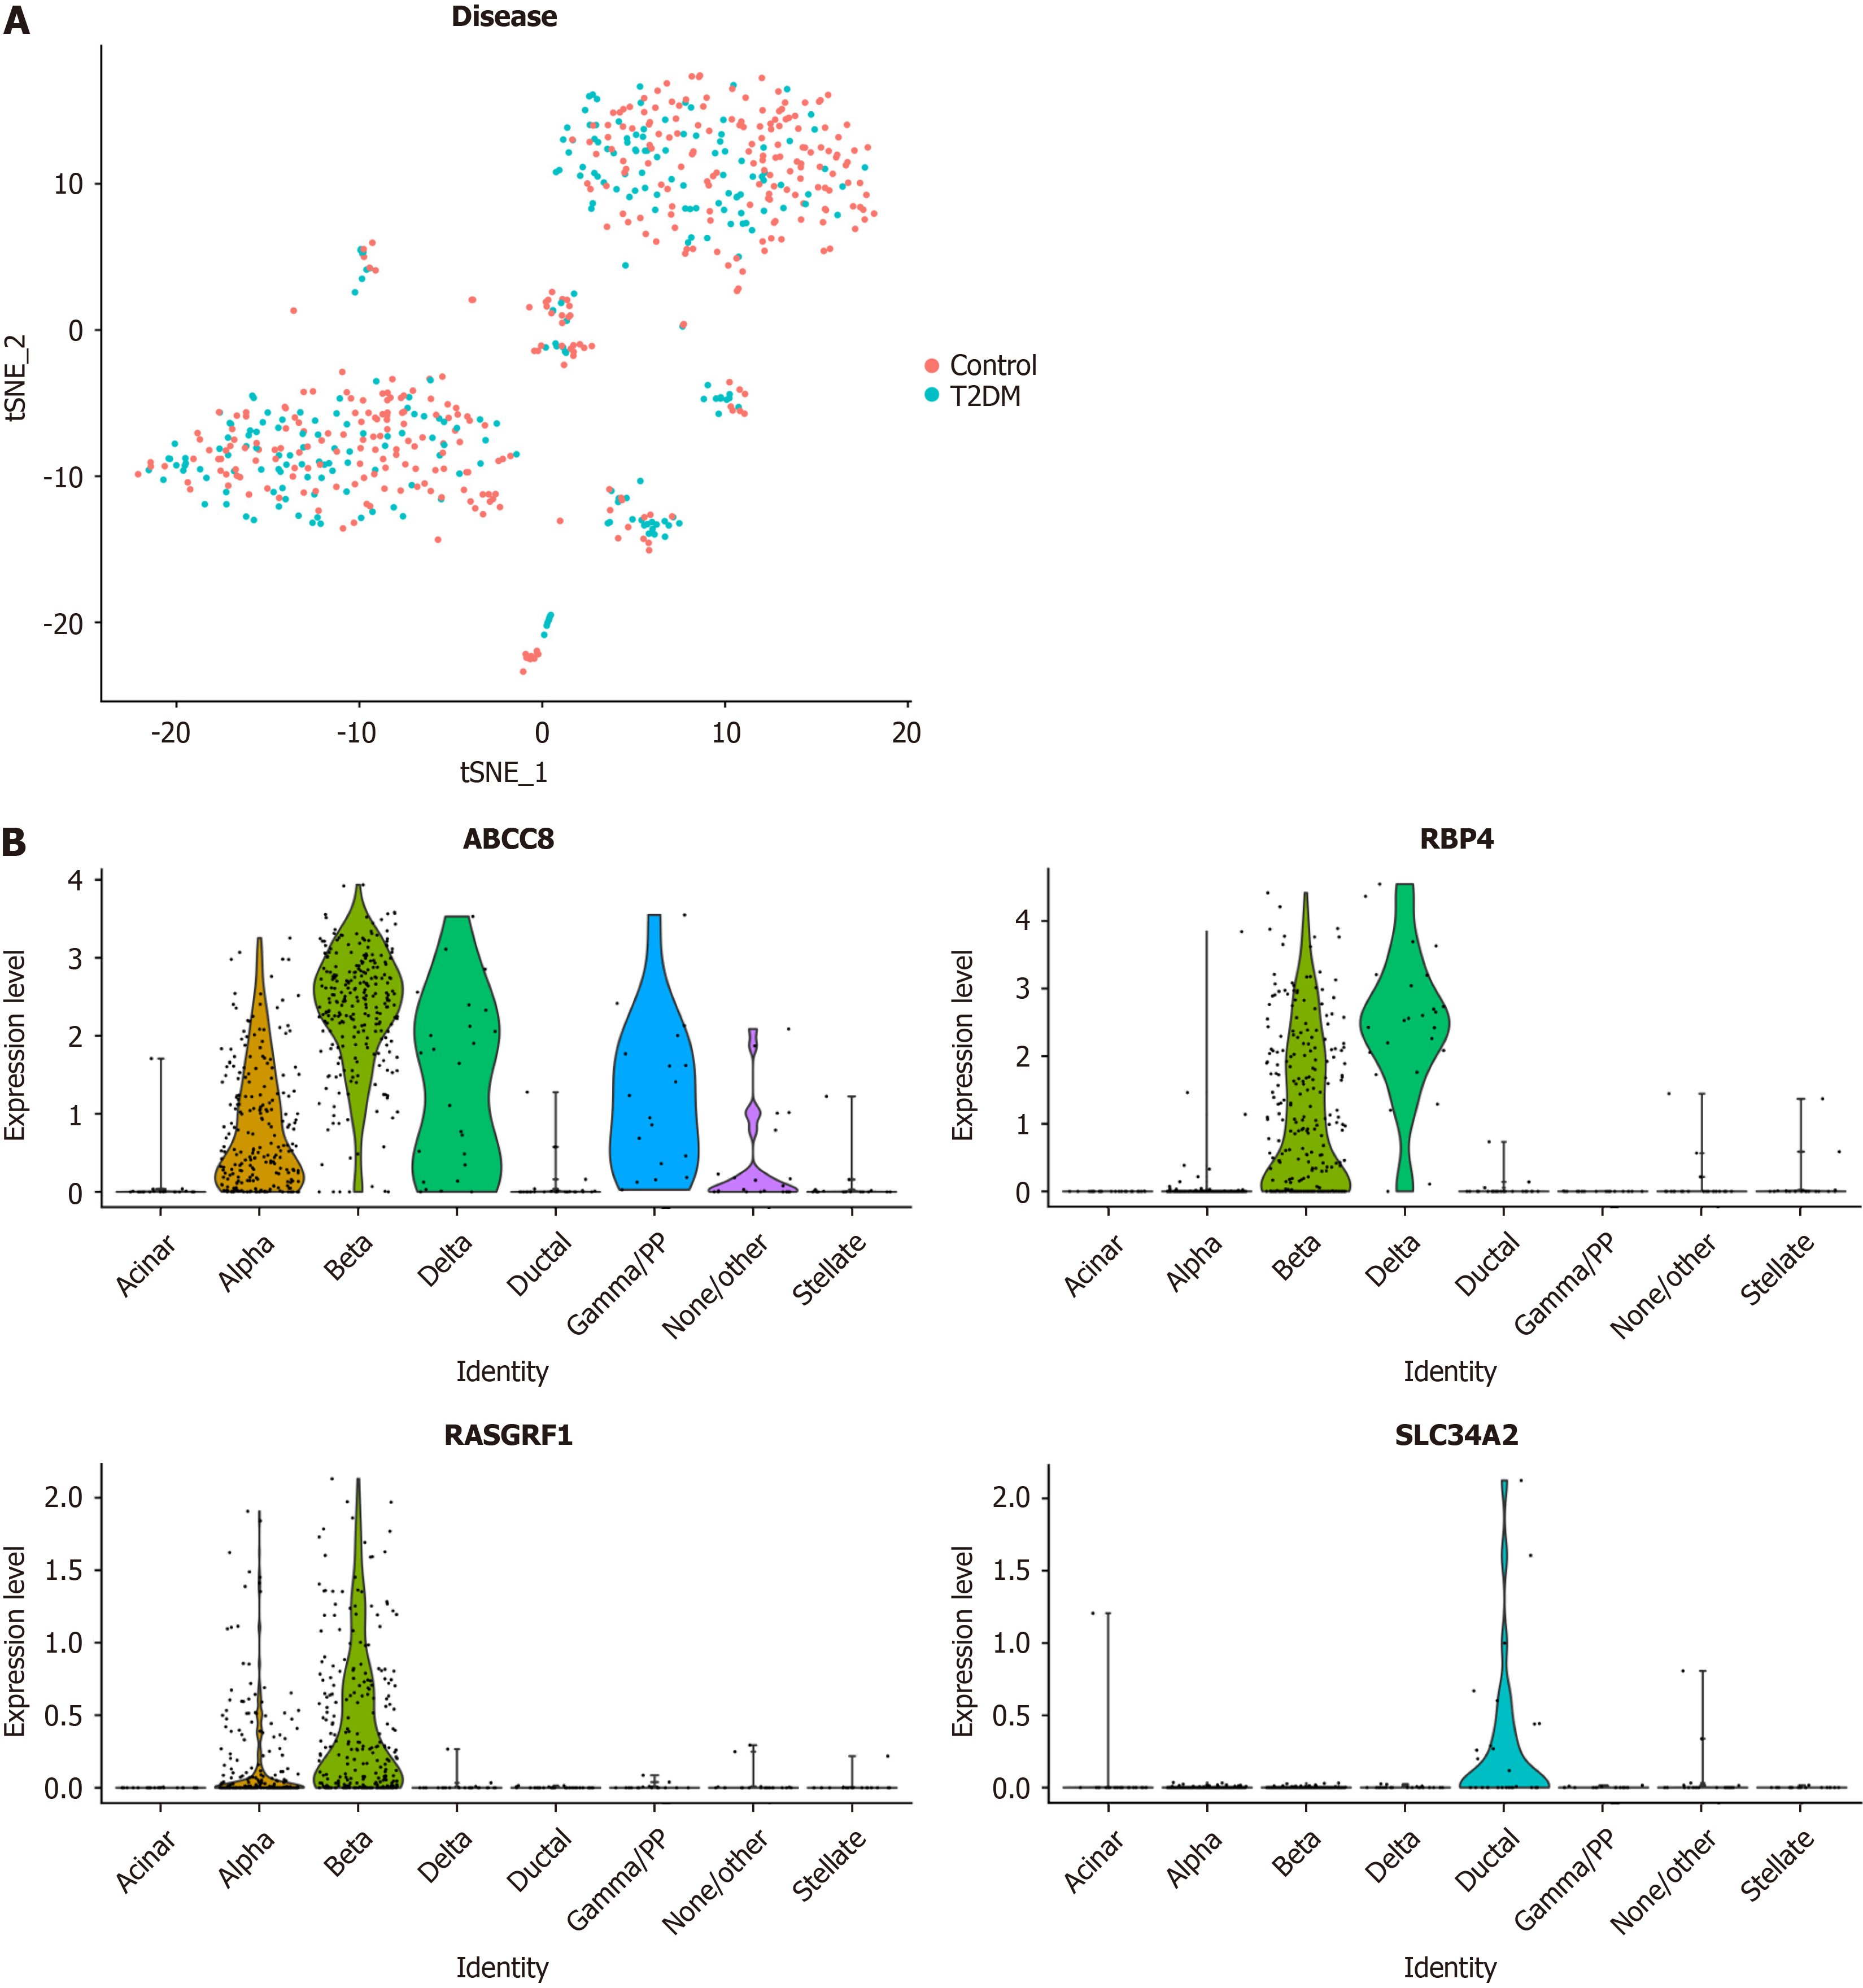
Figure 6 Expression levels of biomarkers in cells based on the single-cell RNA sequencing data.
A: Results of t-distributed Stochastic Neighbor Embedding (t-SNE) clustering results of t-SNE clustering of cells from type 2 diabetes mellitus and normal control samples; B: Expression levels of four biomarkers in eight cell types.
- Citation: Yuan XJ, Zhang ZC, Li J, Ye SD, Zhou W. Identification and mechanistic insights of ubiquitin-proteasome system and pyroptosis-related biomarkers in type 2 diabetes mellitus. World J Diabetes 2025; 16(8): 104879
- URL: https://www.wjgnet.com/1948-9358/full/v16/i8/104879.htm
- DOI: https://dx.doi.org/10.4239/wjd.v16.i8.104879


