Copyright
©The Author(s) 2025.
World J Diabetes. Aug 15, 2025; 16(8): 104879
Published online Aug 15, 2025. doi: 10.4239/wjd.v16.i8.104879
Published online Aug 15, 2025. doi: 10.4239/wjd.v16.i8.104879
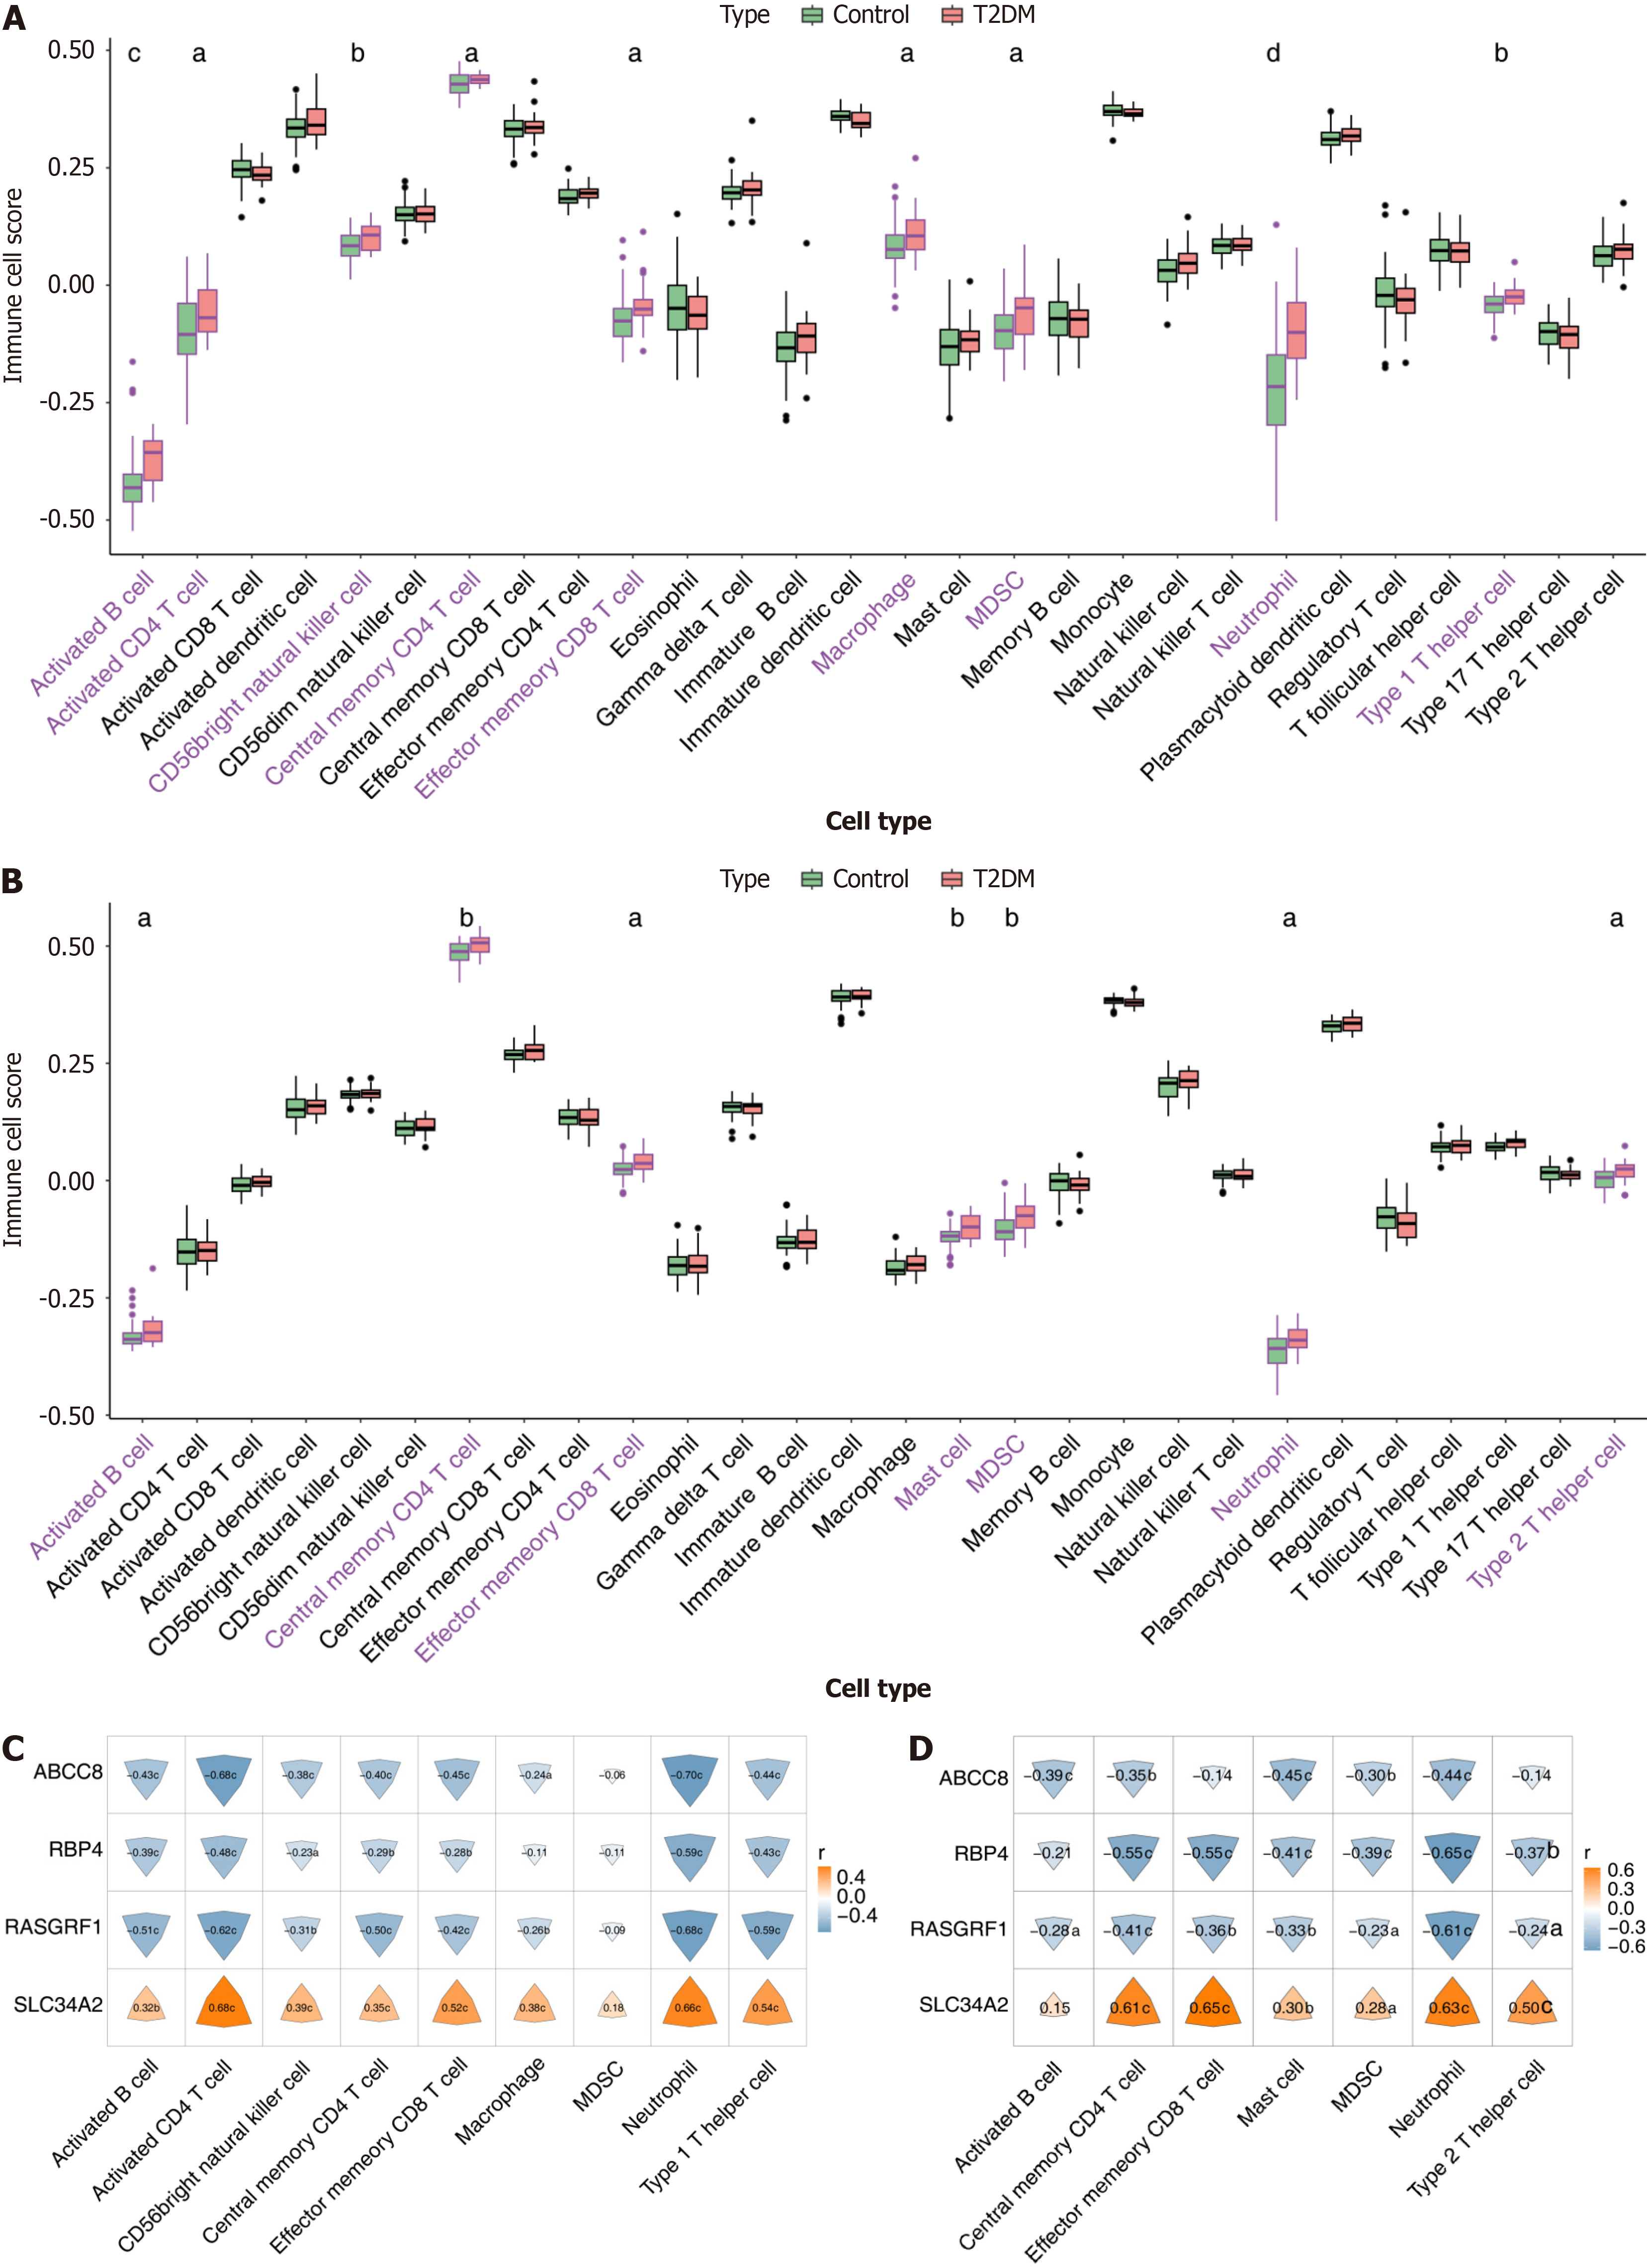
Figure 4 Immune infiltration analysis.
A and B: Comparison of immune cell scores between type 2 diabetes mellitus (T2DM) and normal control groups in training set and validation set; C and D: Correlation of biomarkers to differential immune cells in training set and validation set. The color and size of the irregular shapes in the figure represent the size of the correlation. aP < 0.05; bP < 0.01; cP < 0.001; dP < 0.0001. MDSC: Myeloid-derived suppressor cell.
- Citation: Yuan XJ, Zhang ZC, Li J, Ye SD, Zhou W. Identification and mechanistic insights of ubiquitin-proteasome system and pyroptosis-related biomarkers in type 2 diabetes mellitus. World J Diabetes 2025; 16(8): 104879
- URL: https://www.wjgnet.com/1948-9358/full/v16/i8/104879.htm
- DOI: https://dx.doi.org/10.4239/wjd.v16.i8.104879


