Copyright
©The Author(s) 2025.
World J Diabetes. Jul 15, 2025; 16(7): 103468
Published online Jul 15, 2025. doi: 10.4239/wjd.v16.i7.103468
Published online Jul 15, 2025. doi: 10.4239/wjd.v16.i7.103468
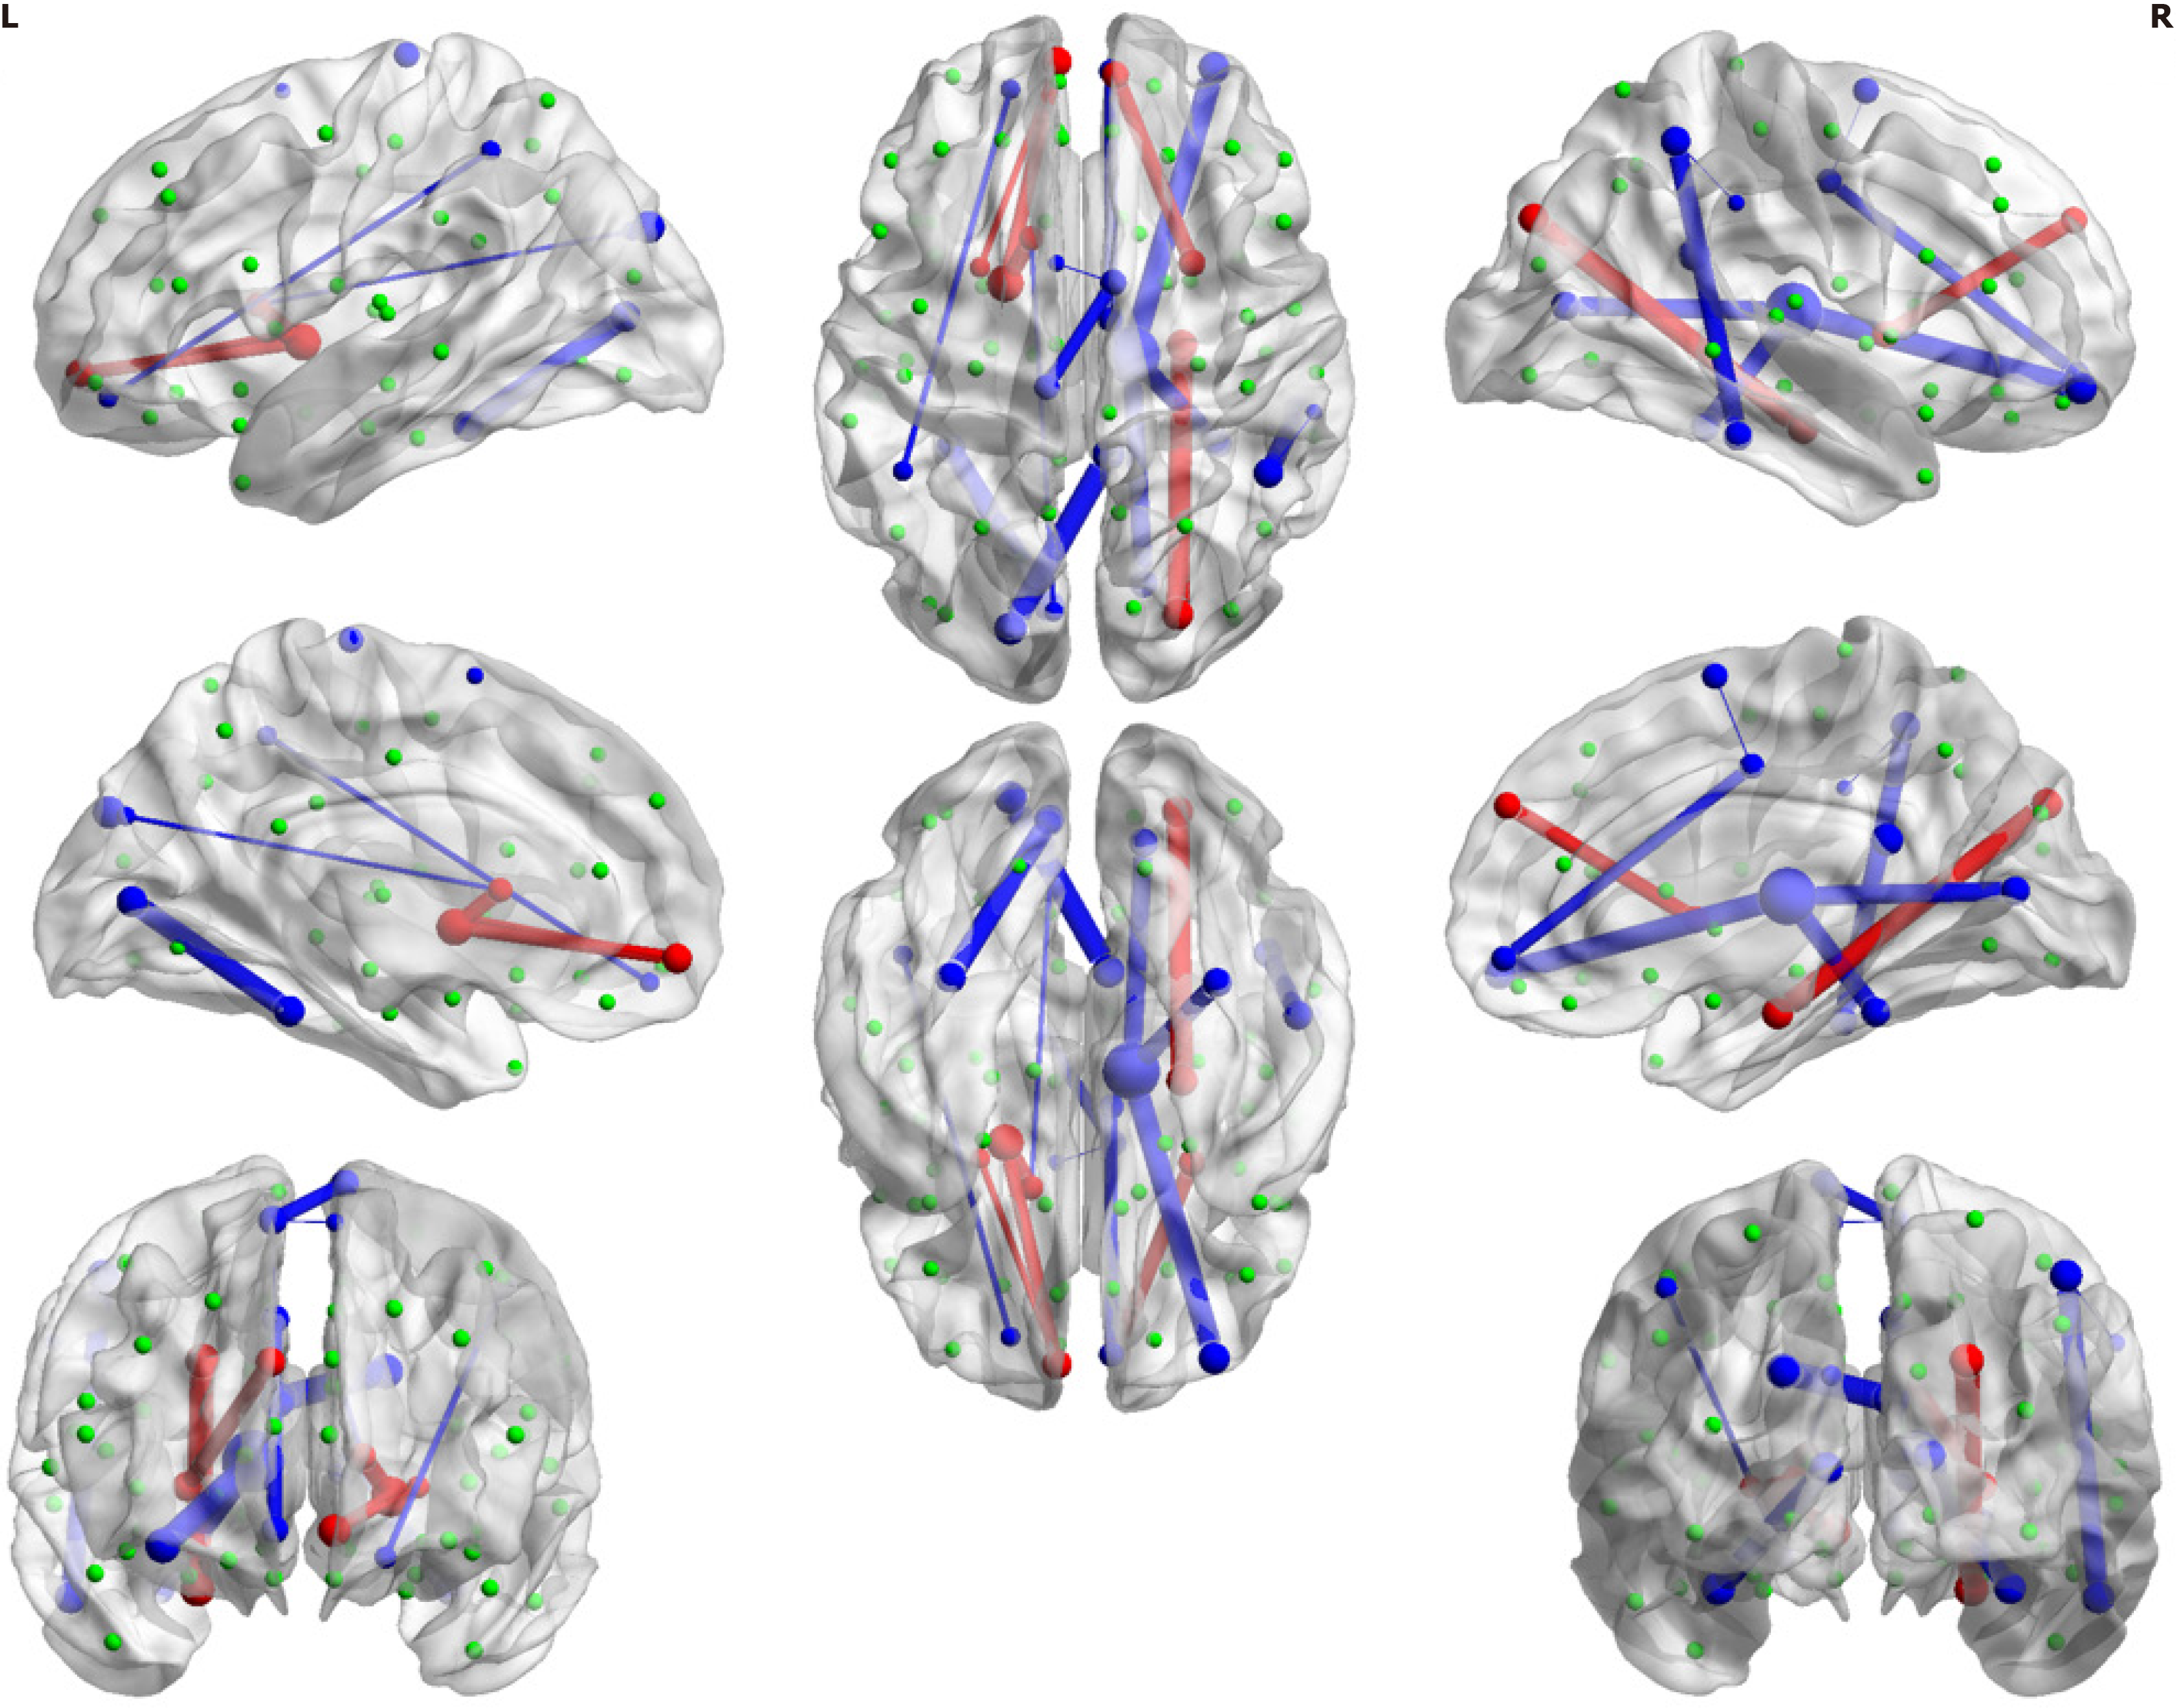
Figure 3 Location of the 18 structural connections selected by forward feature selection.
The blue line indicates that the connection strength is weaker in the type 2 diabetes mellitus (T2DM) group compared to the healthy control group. The red line indicates that the connection strength is stronger in the T2DM group. Thicker lines indicate larger statistical values, indicating greater significance in the observed differences between the groups. The process of the optimal model selection and the model evaluation metrics were included in the Supplementary Figure 2.
- Citation: Li YF, Wei Y, Li MR, Sun ZZ, Xie WY, Li QF, Xie CH, Xiang JY, Tan X, Qiu SJ, Liang Y. Detect the disrupted brain structural connectivity in type 2 diabetes mellitus patients without cognitive impairment. World J Diabetes 2025; 16(7): 103468
- URL: https://www.wjgnet.com/1948-9358/full/v16/i7/103468.htm
- DOI: https://dx.doi.org/10.4239/wjd.v16.i7.103468


