Copyright
©The Author(s) 2025.
World J Diabetes. Jul 15, 2025; 16(7): 103468
Published online Jul 15, 2025. doi: 10.4239/wjd.v16.i7.103468
Published online Jul 15, 2025. doi: 10.4239/wjd.v16.i7.103468
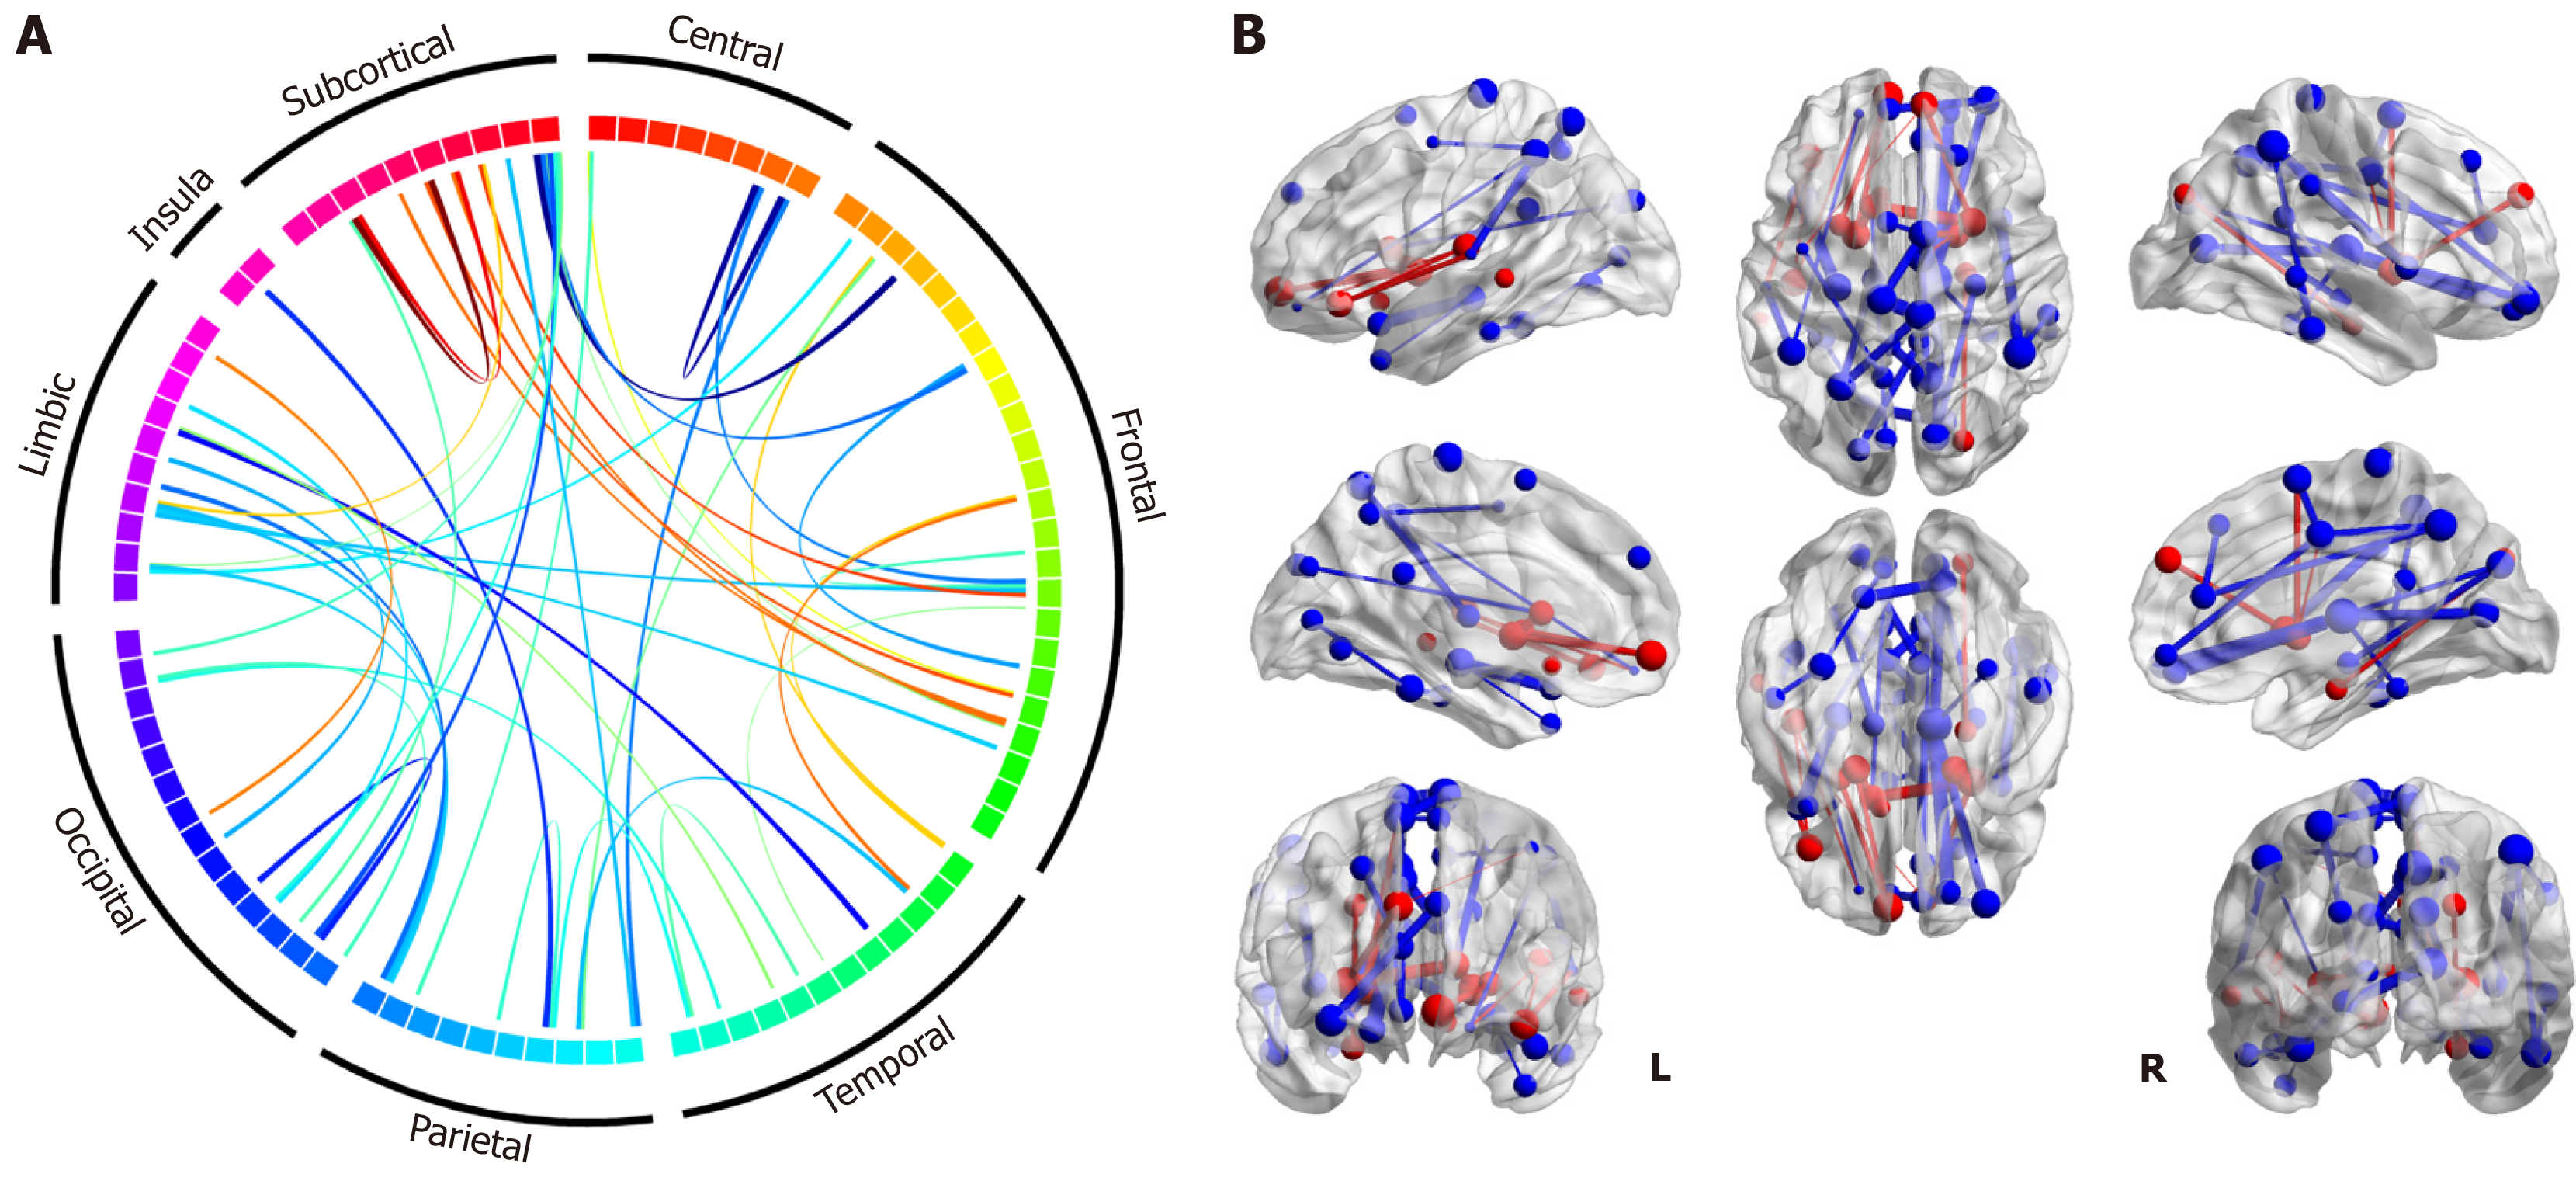
Figure 2 Structural connectivity difference between type 2 diabetes mellitus and healthy control.
The blue line indicates that the connection strength is weaker in the type 2 diabetes mellitus (T2DM) group compared to the healthy control (HC) group. The red line indicates that the connection strength is stronger in the T2DM group. A: Circos plots for structural connections significantly different between two groups. The plot uses AAL90 regions of interest (ROIs) and refers to the eight major regions based on automated anatomical labelling atlas division for the ROIs in cerebral cortex; B: Location of the 47 structural connections significantly different between two groups. Thicker lines indicate larger statistical values, indicating greater significance in the observed differences between the groups.
- Citation: Li YF, Wei Y, Li MR, Sun ZZ, Xie WY, Li QF, Xie CH, Xiang JY, Tan X, Qiu SJ, Liang Y. Detect the disrupted brain structural connectivity in type 2 diabetes mellitus patients without cognitive impairment. World J Diabetes 2025; 16(7): 103468
- URL: https://www.wjgnet.com/1948-9358/full/v16/i7/103468.htm
- DOI: https://dx.doi.org/10.4239/wjd.v16.i7.103468


