
















©The Author(s) 2025.
World J Diabetes. Jul 15, 2025; 16(7): 103468
Published online Jul 15, 2025. doi: 10.4239/wjd.v16.i7.103468
Published online Jul 15, 2025. doi: 10.4239/wjd.v16.i7.103468
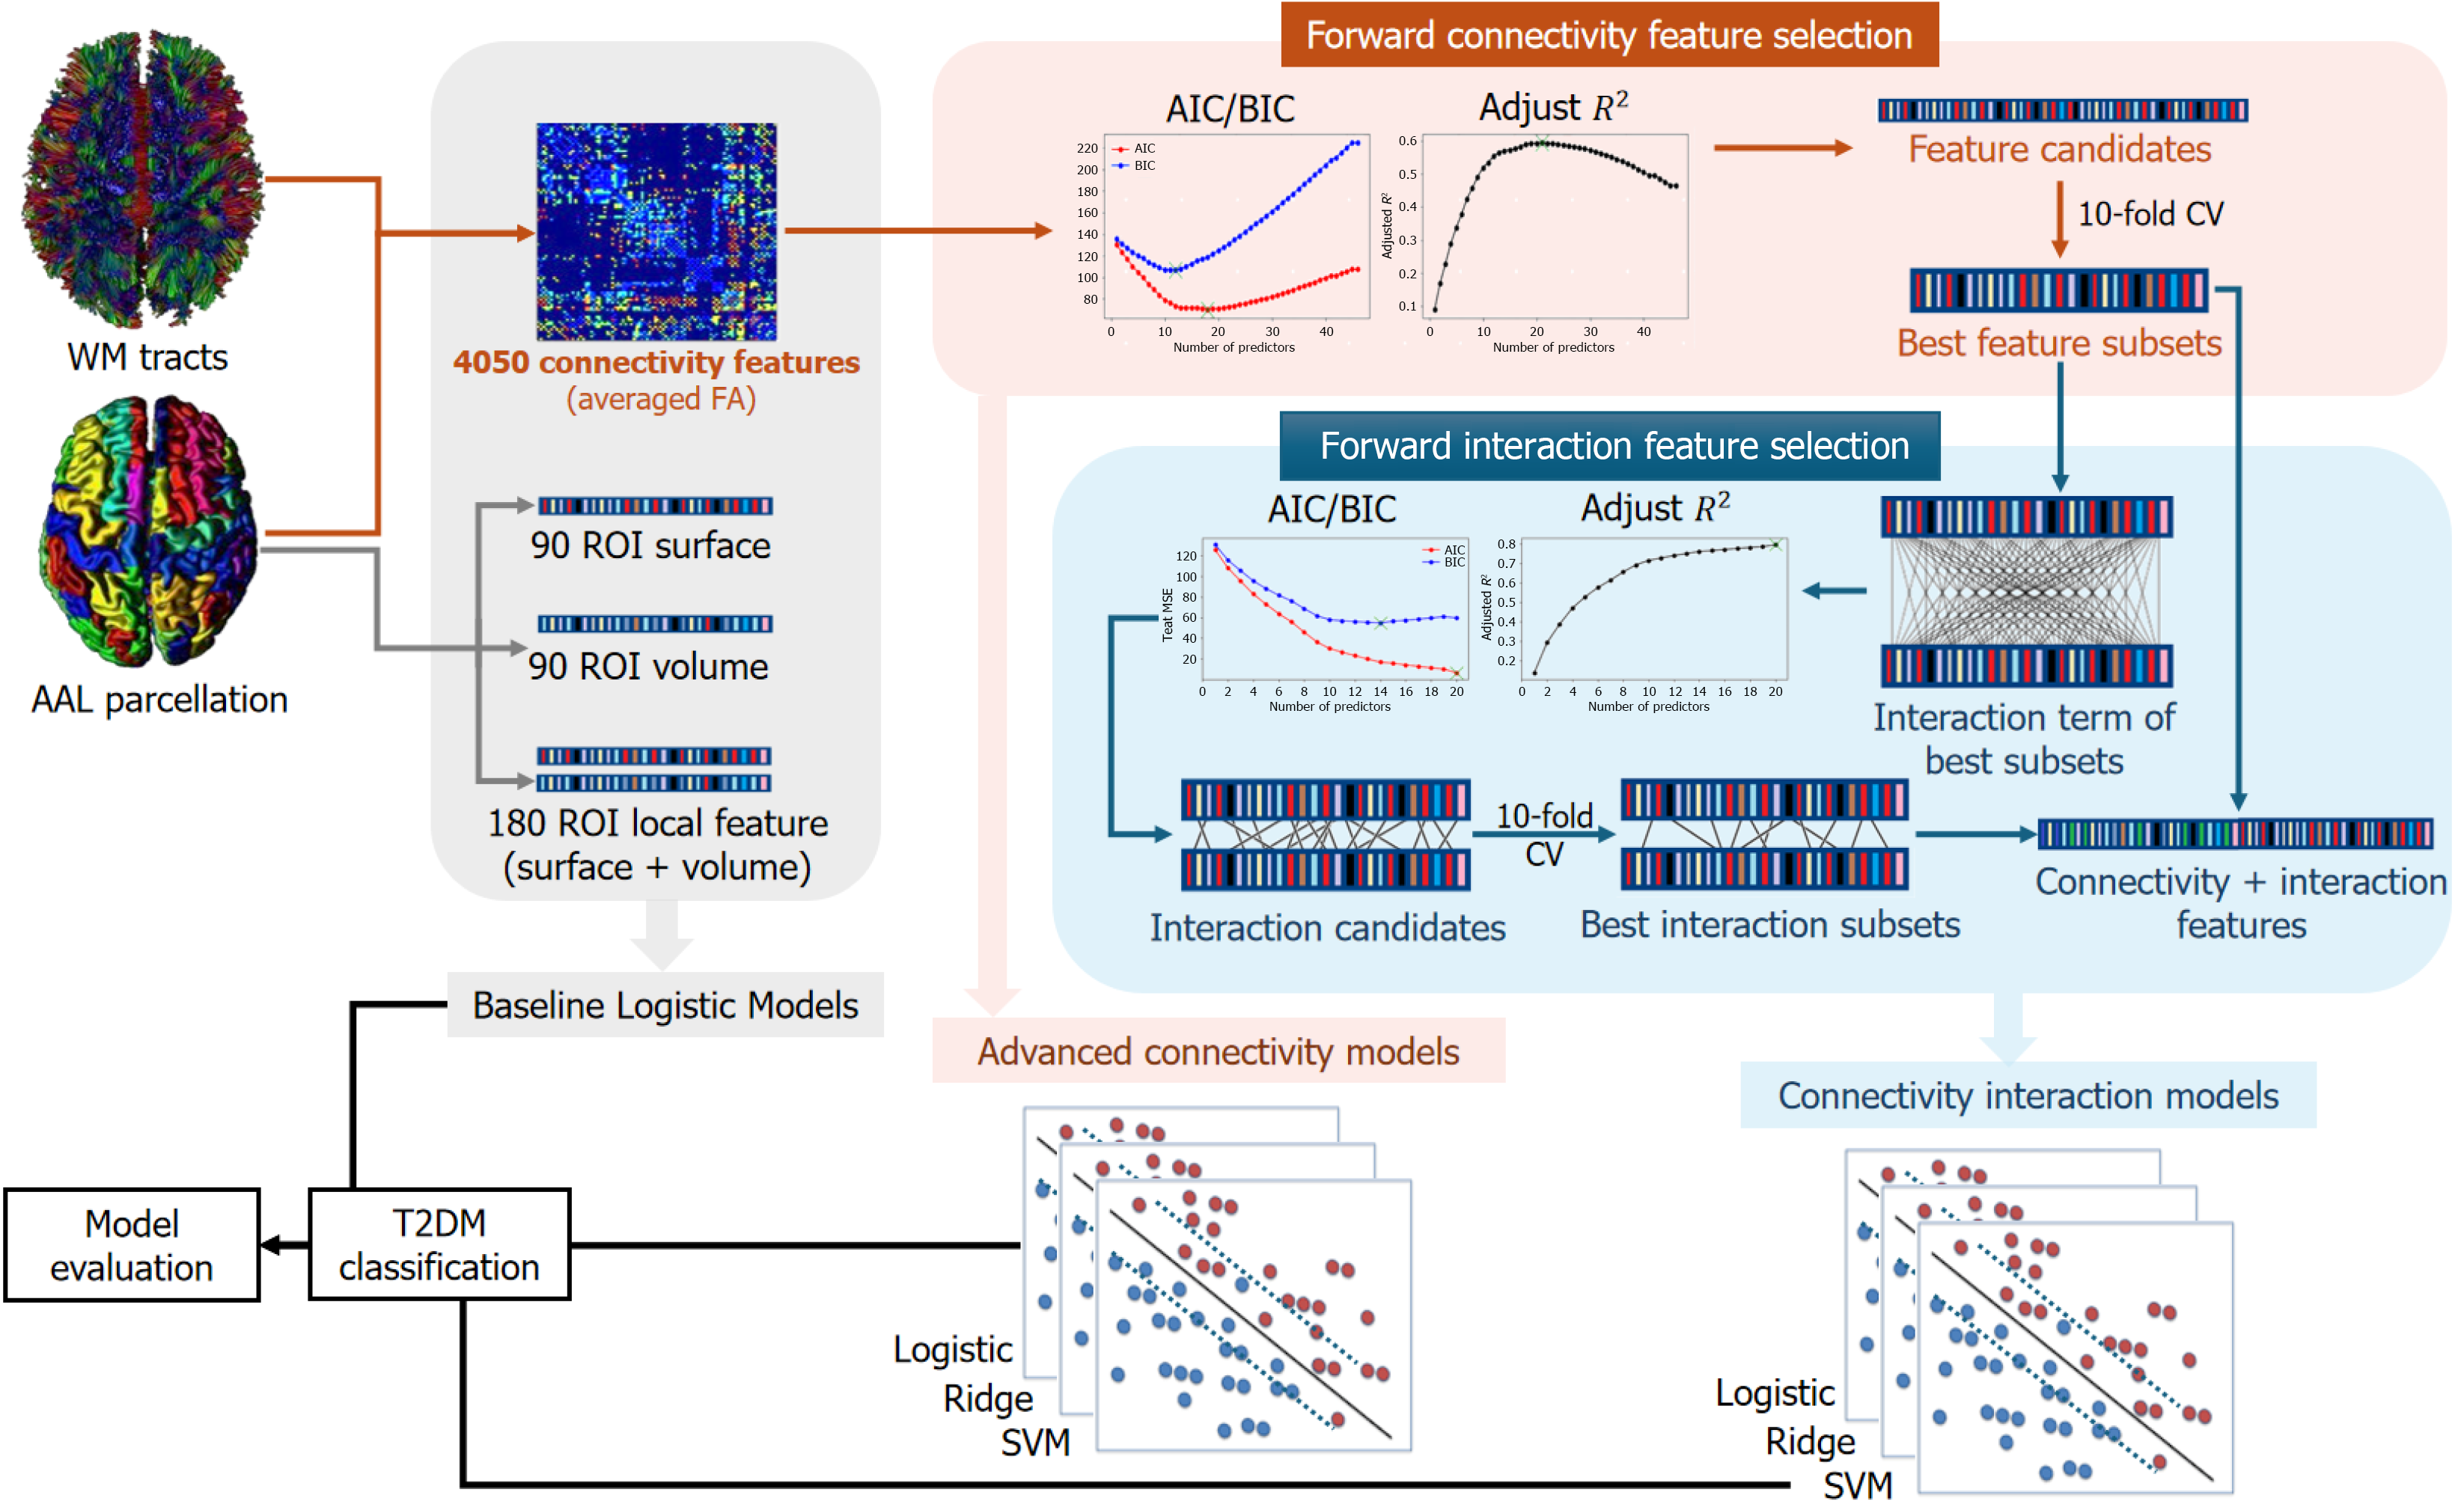
Figure 1 Illustration for the classification schematic flow.
The schematic flow for building the classification models involved the application of feature selection metrics (Akaike information criterion, Bayesian information criterion, and adjusted R2) to select connectivity feature candidates, and 10-fold cross validation (CV) was used to determine the optimal feature subsets. Then, interaction terms were screened on the selected connectivity features to further improve the model's performance. Finally, all the models were evaluated using 10-fold CV on accuracy: Precision, recall and F1-score. The feature selection process is outlined in more detail in Supplementary Figure 2. Note that all baseline models used Logistic classification. WM: White matter; AAL: Automated anatomical labelling atlas; ROI: Region of interest; FA: Fractional anisotropy; AIC: Akaike information criterion; BIC: Bayesian information criterion; CV: Cross validation; T2DM: Type 2 diabetes mellitus; Logistic: Logistic classification; Ridge: Ridge classification; SVM: Supporting vector machine.
- Citation: Li YF, Wei Y, Li MR, Sun ZZ, Xie WY, Li QF, Xie CH, Xiang JY, Tan X, Qiu SJ, Liang Y. Detect the disrupted brain structural connectivity in type 2 diabetes mellitus patients without cognitive impairment. World J Diabetes 2025; 16(7): 103468
- URL: https://www.wjgnet.com/1948-9358/full/v16/i7/103468.htm
- DOI: https://dx.doi.org/10.4239/wjd.v16.i7.103468