Copyright
©The Author(s) 2025.
World J Diabetes. Jun 15, 2025; 16(6): 105592
Published online Jun 15, 2025. doi: 10.4239/wjd.v16.i6.105592
Published online Jun 15, 2025. doi: 10.4239/wjd.v16.i6.105592
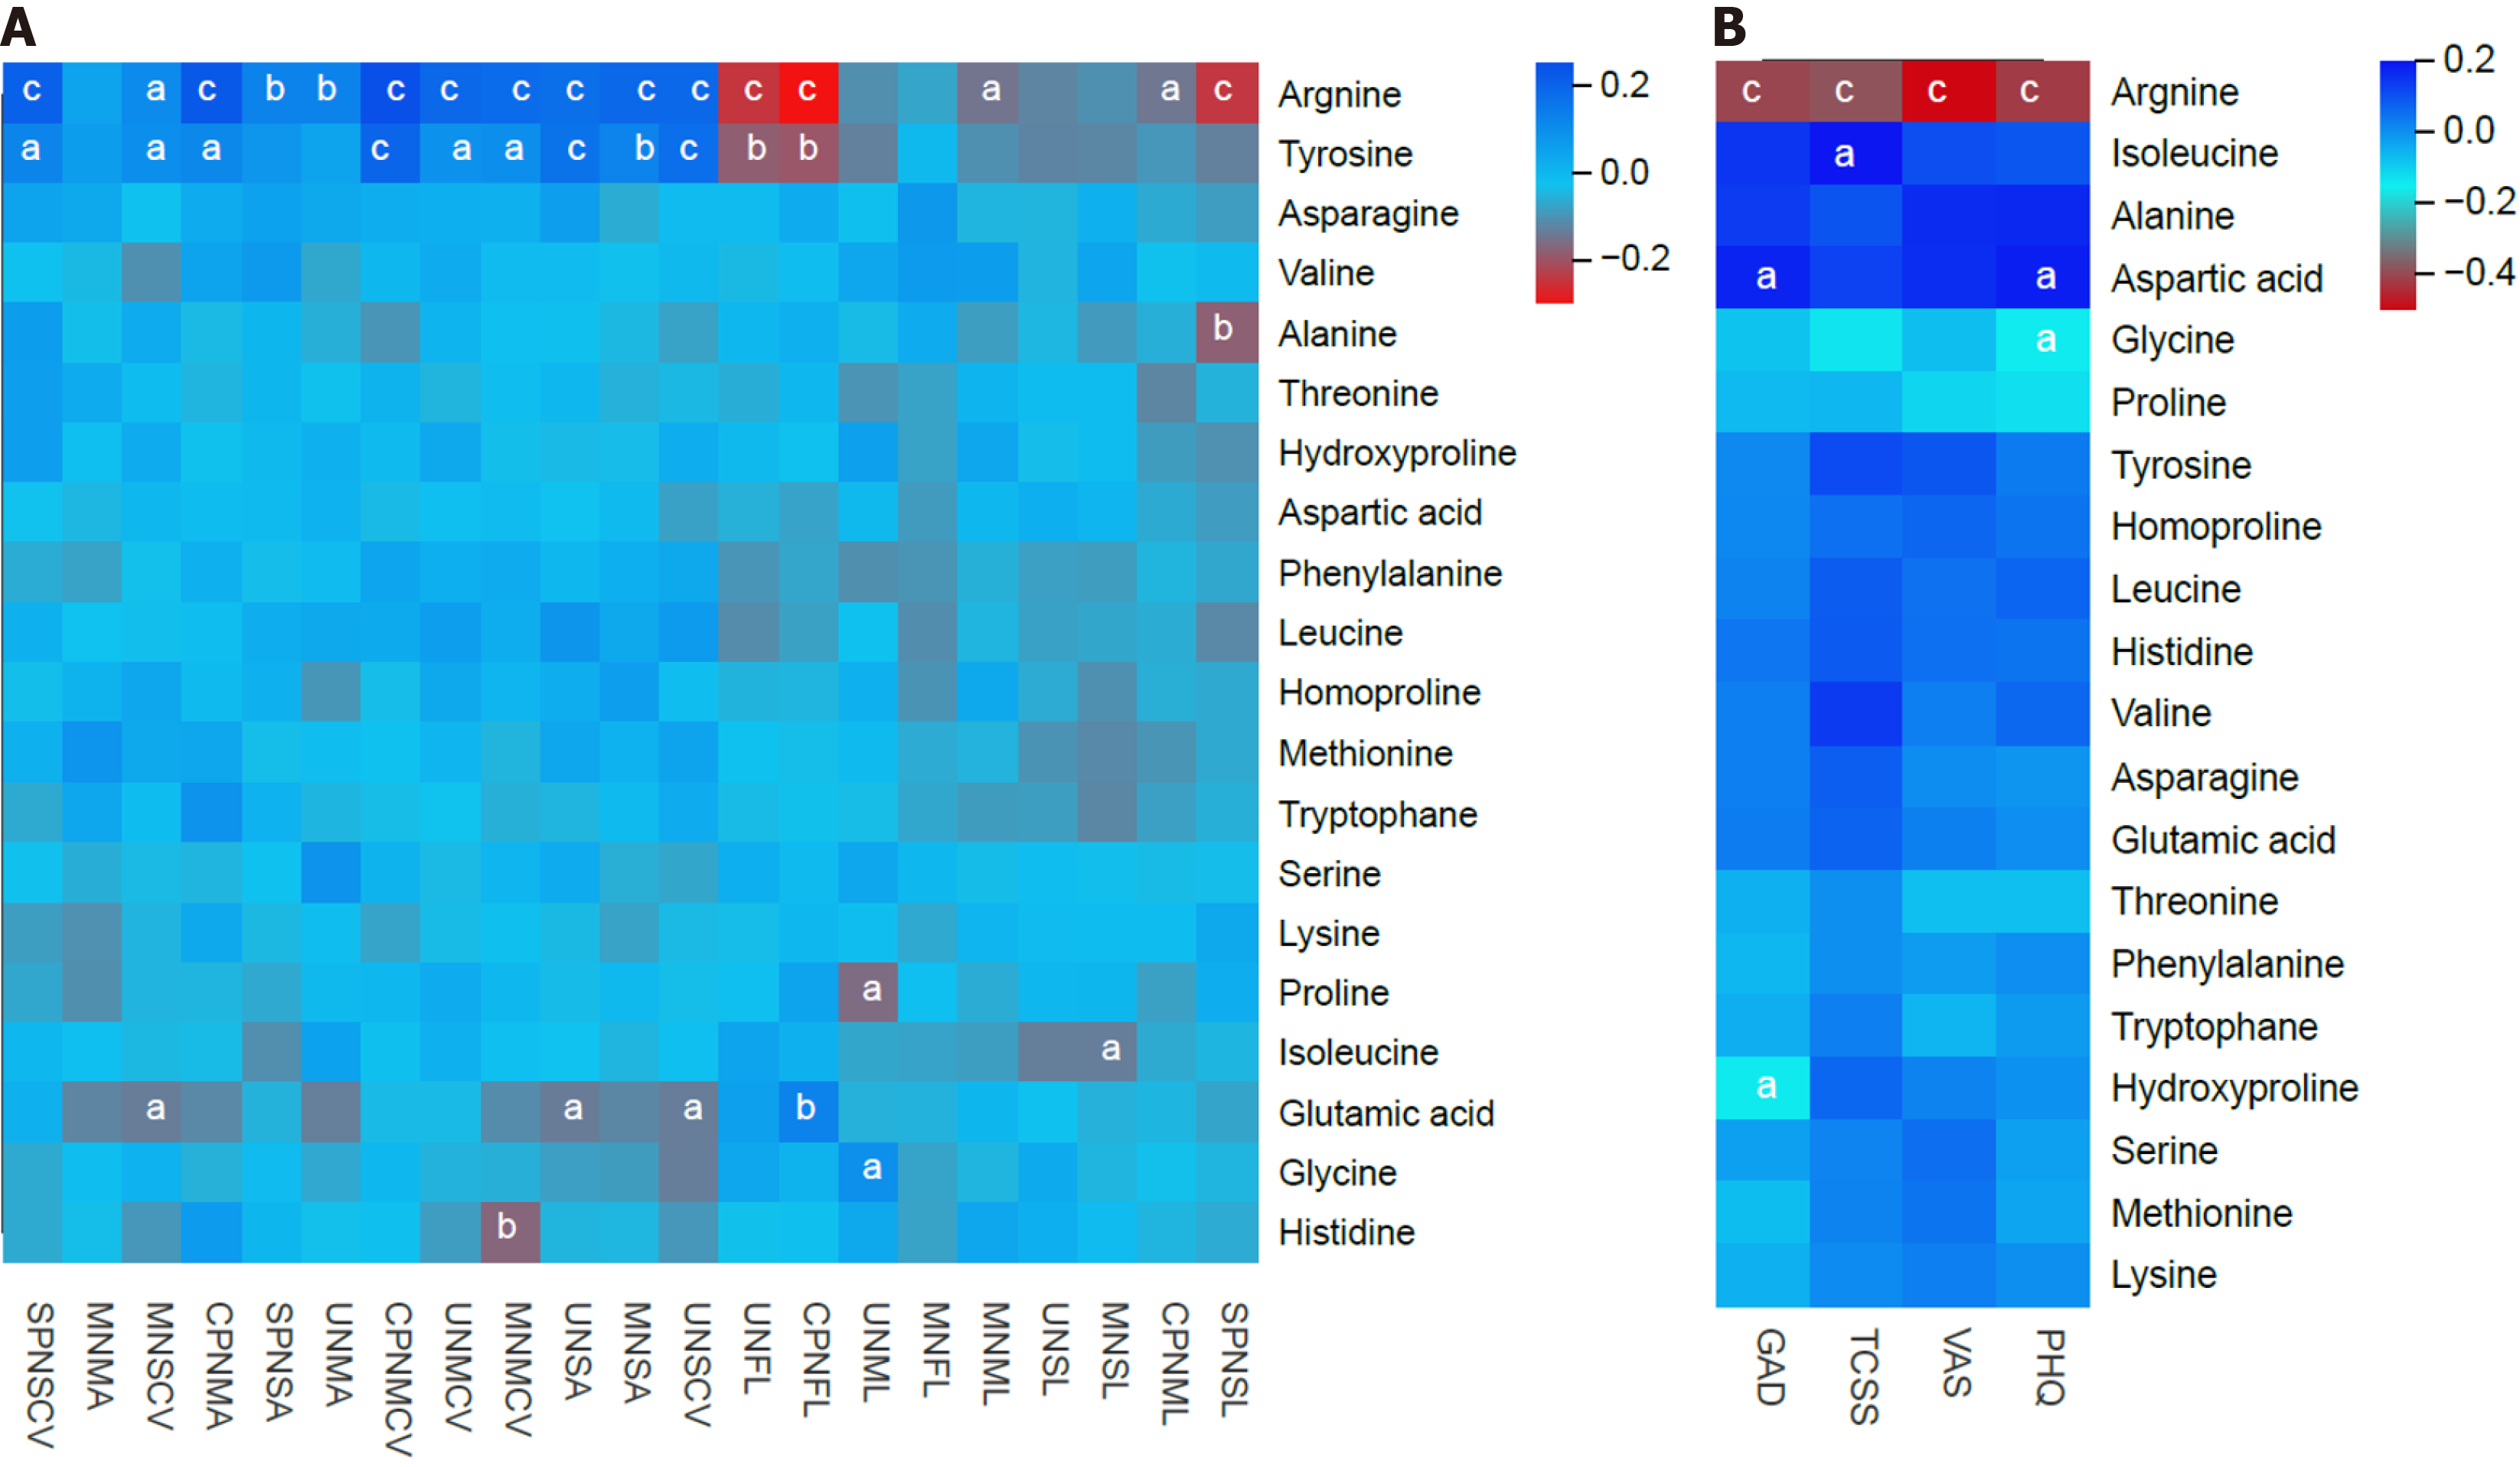
Figure 6 Heatmap correlation between the measured serum amino acid levels and both electromyography parameters and clinical scores.
A: Electromyography parameters; B: Clinical scores. aP < 0.05; bP < 0.01; cP < 0.001; PHQ: Patient health questionnaire; VAS: Visual analog scale; TCSS: Toronto Clinical Scoring System; GAD: Generalized anxiety disorder questionnaire.
- Citation: Xu WS, Xing H, Wang QQ, Qi H, He JT, Jin T, Kan YP, Sun SY, Wang JY, Lin FQ. Identification and validation of serum amino acids as diagnostic biomarkers for diabetic peripheral neuropathy. World J Diabetes 2025; 16(6): 105592
- URL: https://www.wjgnet.com/1948-9358/full/v16/i6/105592.htm
- DOI: https://dx.doi.org/10.4239/wjd.v16.i6.105592


