Copyright
©The Author(s) 2025.
World J Diabetes. Jun 15, 2025; 16(6): 104120
Published online Jun 15, 2025. doi: 10.4239/wjd.v16.i6.104120
Published online Jun 15, 2025. doi: 10.4239/wjd.v16.i6.104120
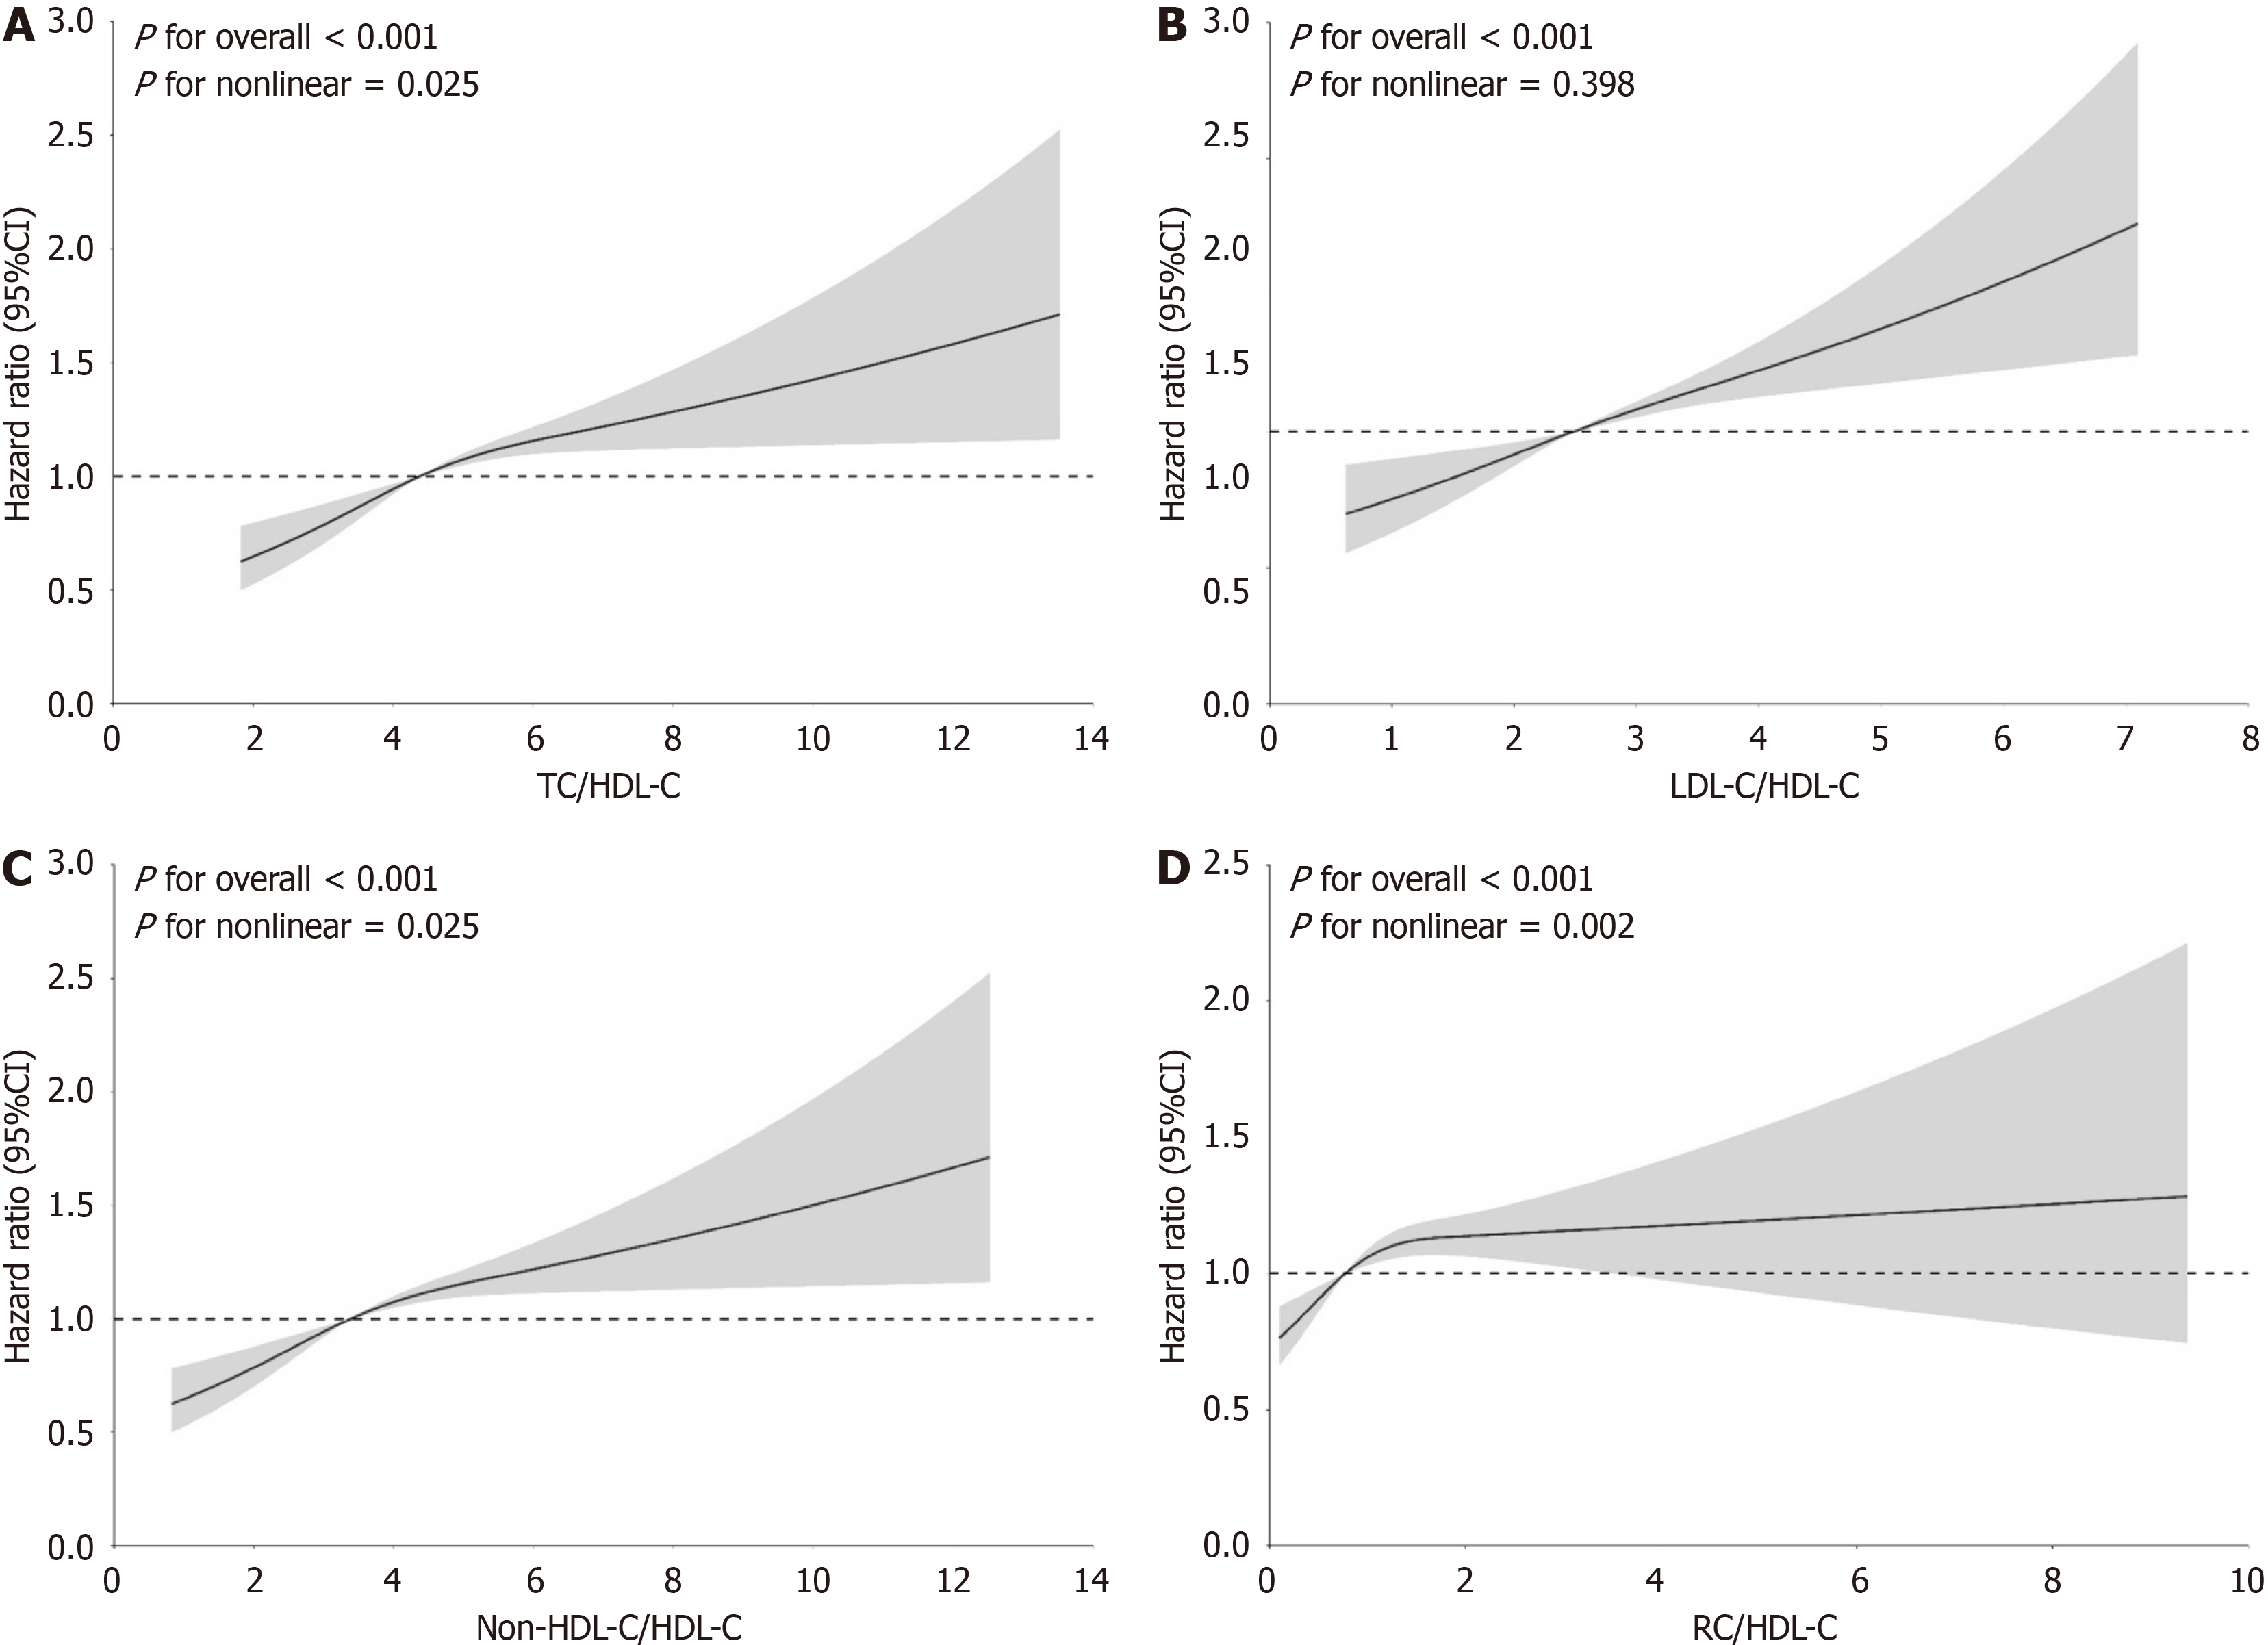
Figure 2 Restricted cubic spline analyses of nontraditional lipoprotein ratios to estimate the risk of major adverse cardiovascular events after adjusting for multivariate covariates.
The reference point is the median, with knots placed at the 10th, 50th, and 90th percentiles of each nontraditional lipoprotein ratios distribution. The hazard ratios shown are adjusted for model 4, including sex, age, race, educational level, depression, cigarette-smoking status, duration of type 2 diabetes mellitus, previous cardiovascular events, previous heart failure, previous hypertension, body mass index, systolic blood pressure, diastolic blood pressure, hemoglobin A1c, fasting blood glucose, estimated glomerular filtration rate, insulin use, biguanide use, beta-blocker use, and statin use. A: Total cholesterol/high-density lipoprotein cholesterol (HDL-C); B: Low-density lipoprotein cholesterol/HDL-C; C: Non-HDL-C/HDL-C; D: RC/HDL-C hazard ratios are indicated by solid lines and the 95% confidence intervals by shaded areas. TC: Total cholesterol; HDL-C: High-density lipoprotein cholesterol; LDL-C: Low-density lipoprotein cholesterol; RC: Remnant cholesterol; CI: Confidence interval.
- Citation: Deng SM, Hu XQ, Zhang XY. Associations of nontraditional lipoprotein ratios with future cardiovascular events in patients with type 2 diabetes mellitus. World J Diabetes 2025; 16(6): 104120
- URL: https://www.wjgnet.com/1948-9358/full/v16/i6/104120.htm
- DOI: https://dx.doi.org/10.4239/wjd.v16.i6.104120


