Copyright
©The Author(s) 2025.
World J Diabetes. Jun 15, 2025; 16(6): 104024
Published online Jun 15, 2025. doi: 10.4239/wjd.v16.i6.104024
Published online Jun 15, 2025. doi: 10.4239/wjd.v16.i6.104024
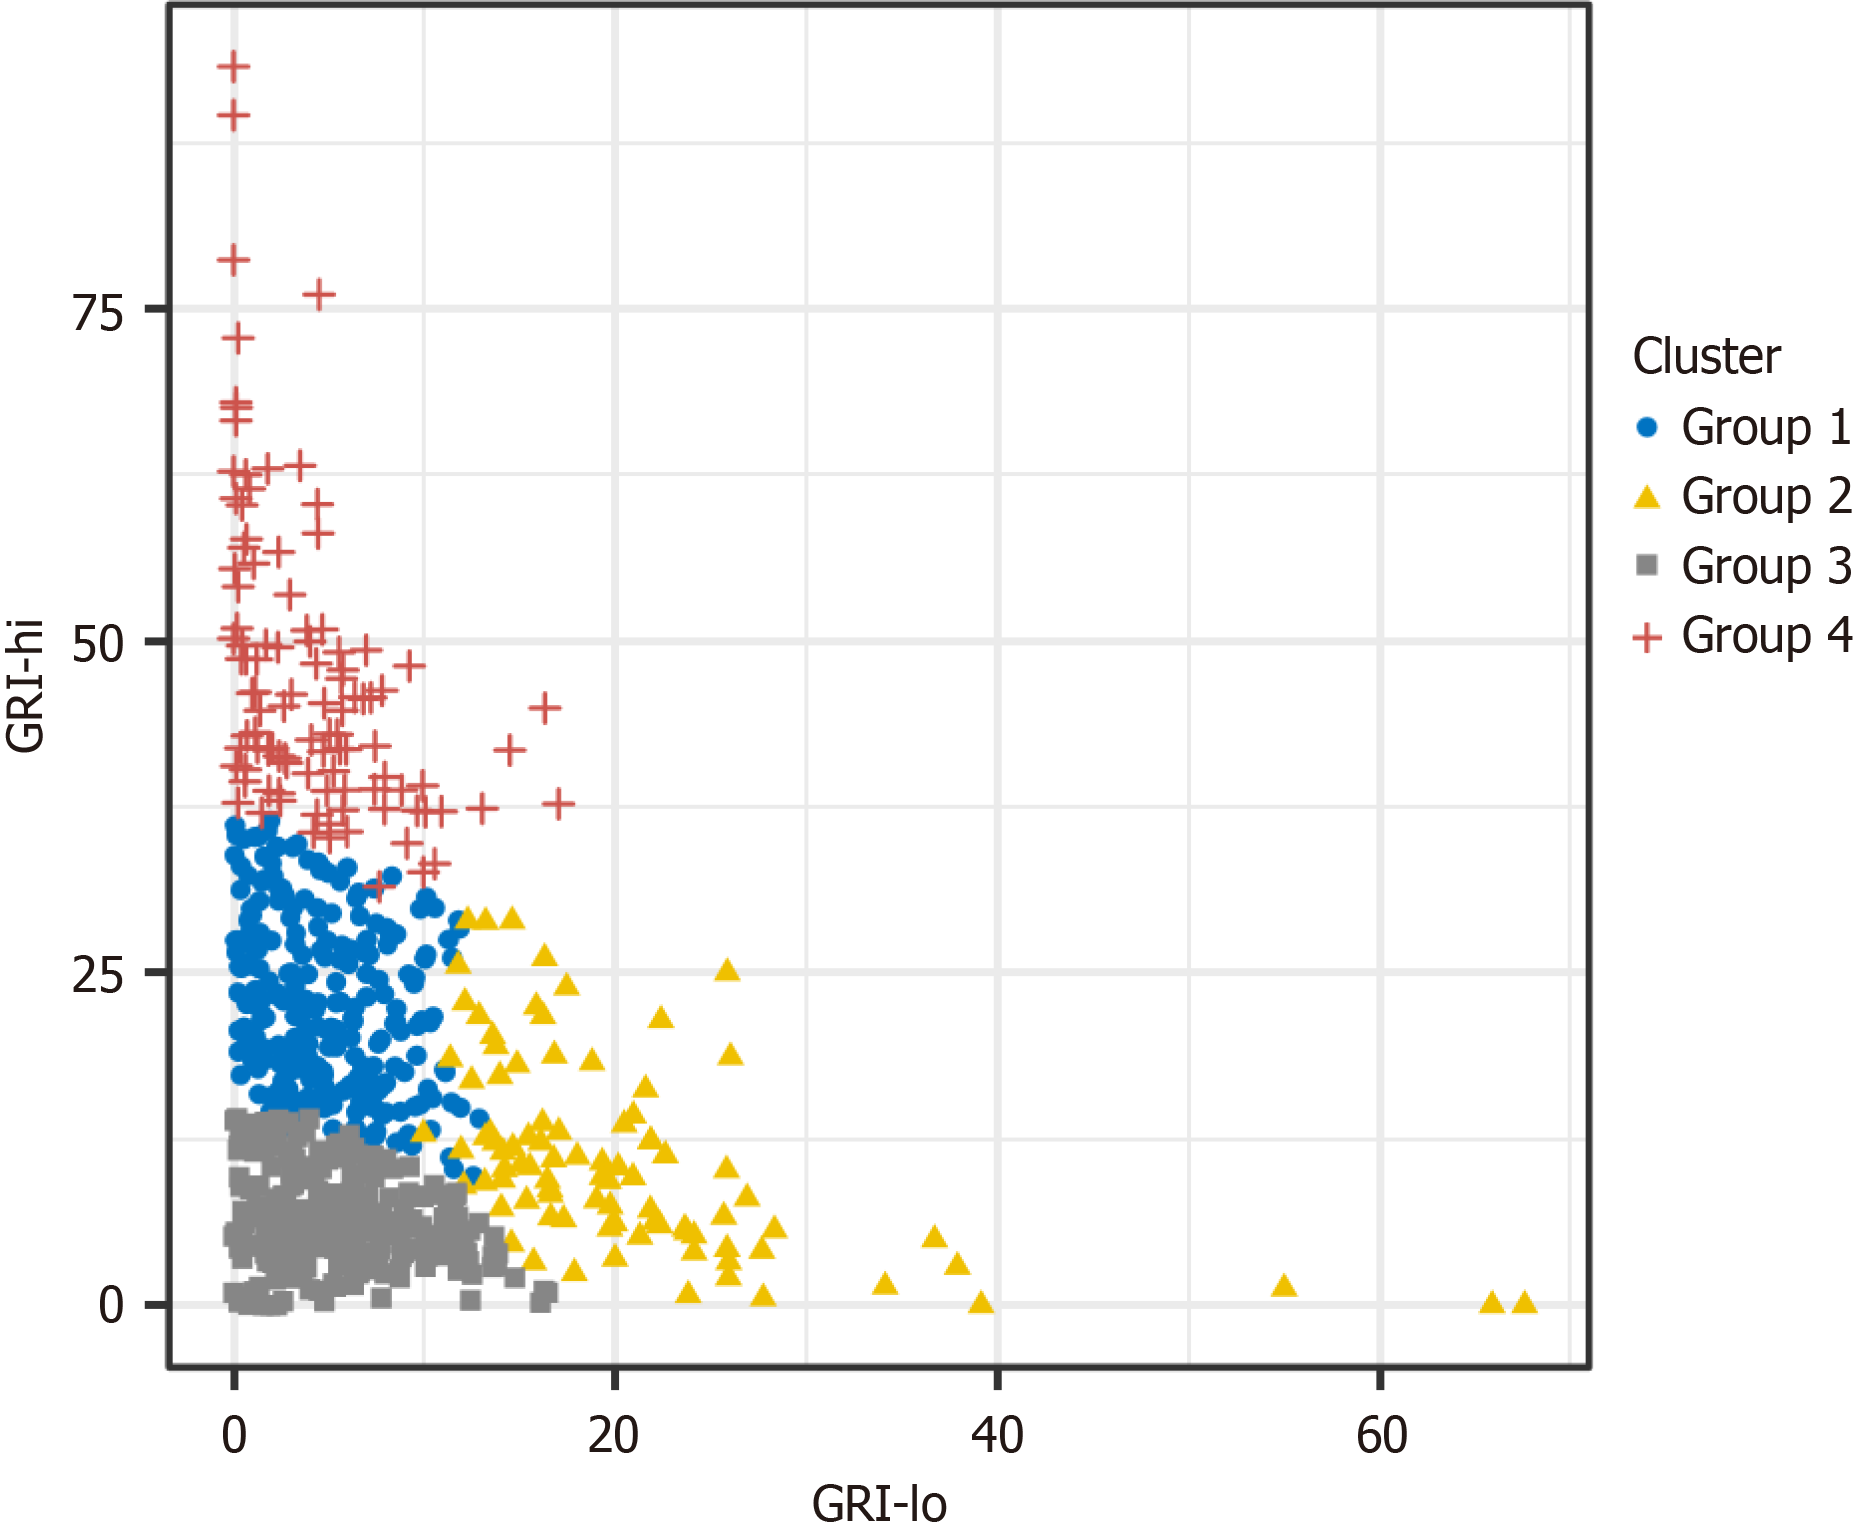
Figure 3 Distribution of patients across the four groups on the glycemia risk index grid two-dimensional plot.
Group 1 was the moderate-risk group. Group 2 was the high-risk group for hypoglycemia. Group 3 was the optimal glycemic control group. Group 4 was the high-risk group for hyperglycemia. GRI-lo: Hypoglycemia component of glycemia risk index; GRI-hi: The hyperglycemia component of glycemia risk index.
- Citation: He BB, Liu ZZ, Xu RY, Fan L, Guo R, Deng C, Xie YT, Zhou ZG, Li X. Glycated hemoglobin is not enough: The role of glycemia risk index for glycemic control assessment in type 1 diabetes. World J Diabetes 2025; 16(6): 104024
- URL: https://www.wjgnet.com/1948-9358/full/v16/i6/104024.htm
- DOI: https://dx.doi.org/10.4239/wjd.v16.i6.104024


