Copyright
©The Author(s) 2025.
World J Diabetes. Jun 15, 2025; 16(6): 104024
Published online Jun 15, 2025. doi: 10.4239/wjd.v16.i6.104024
Published online Jun 15, 2025. doi: 10.4239/wjd.v16.i6.104024
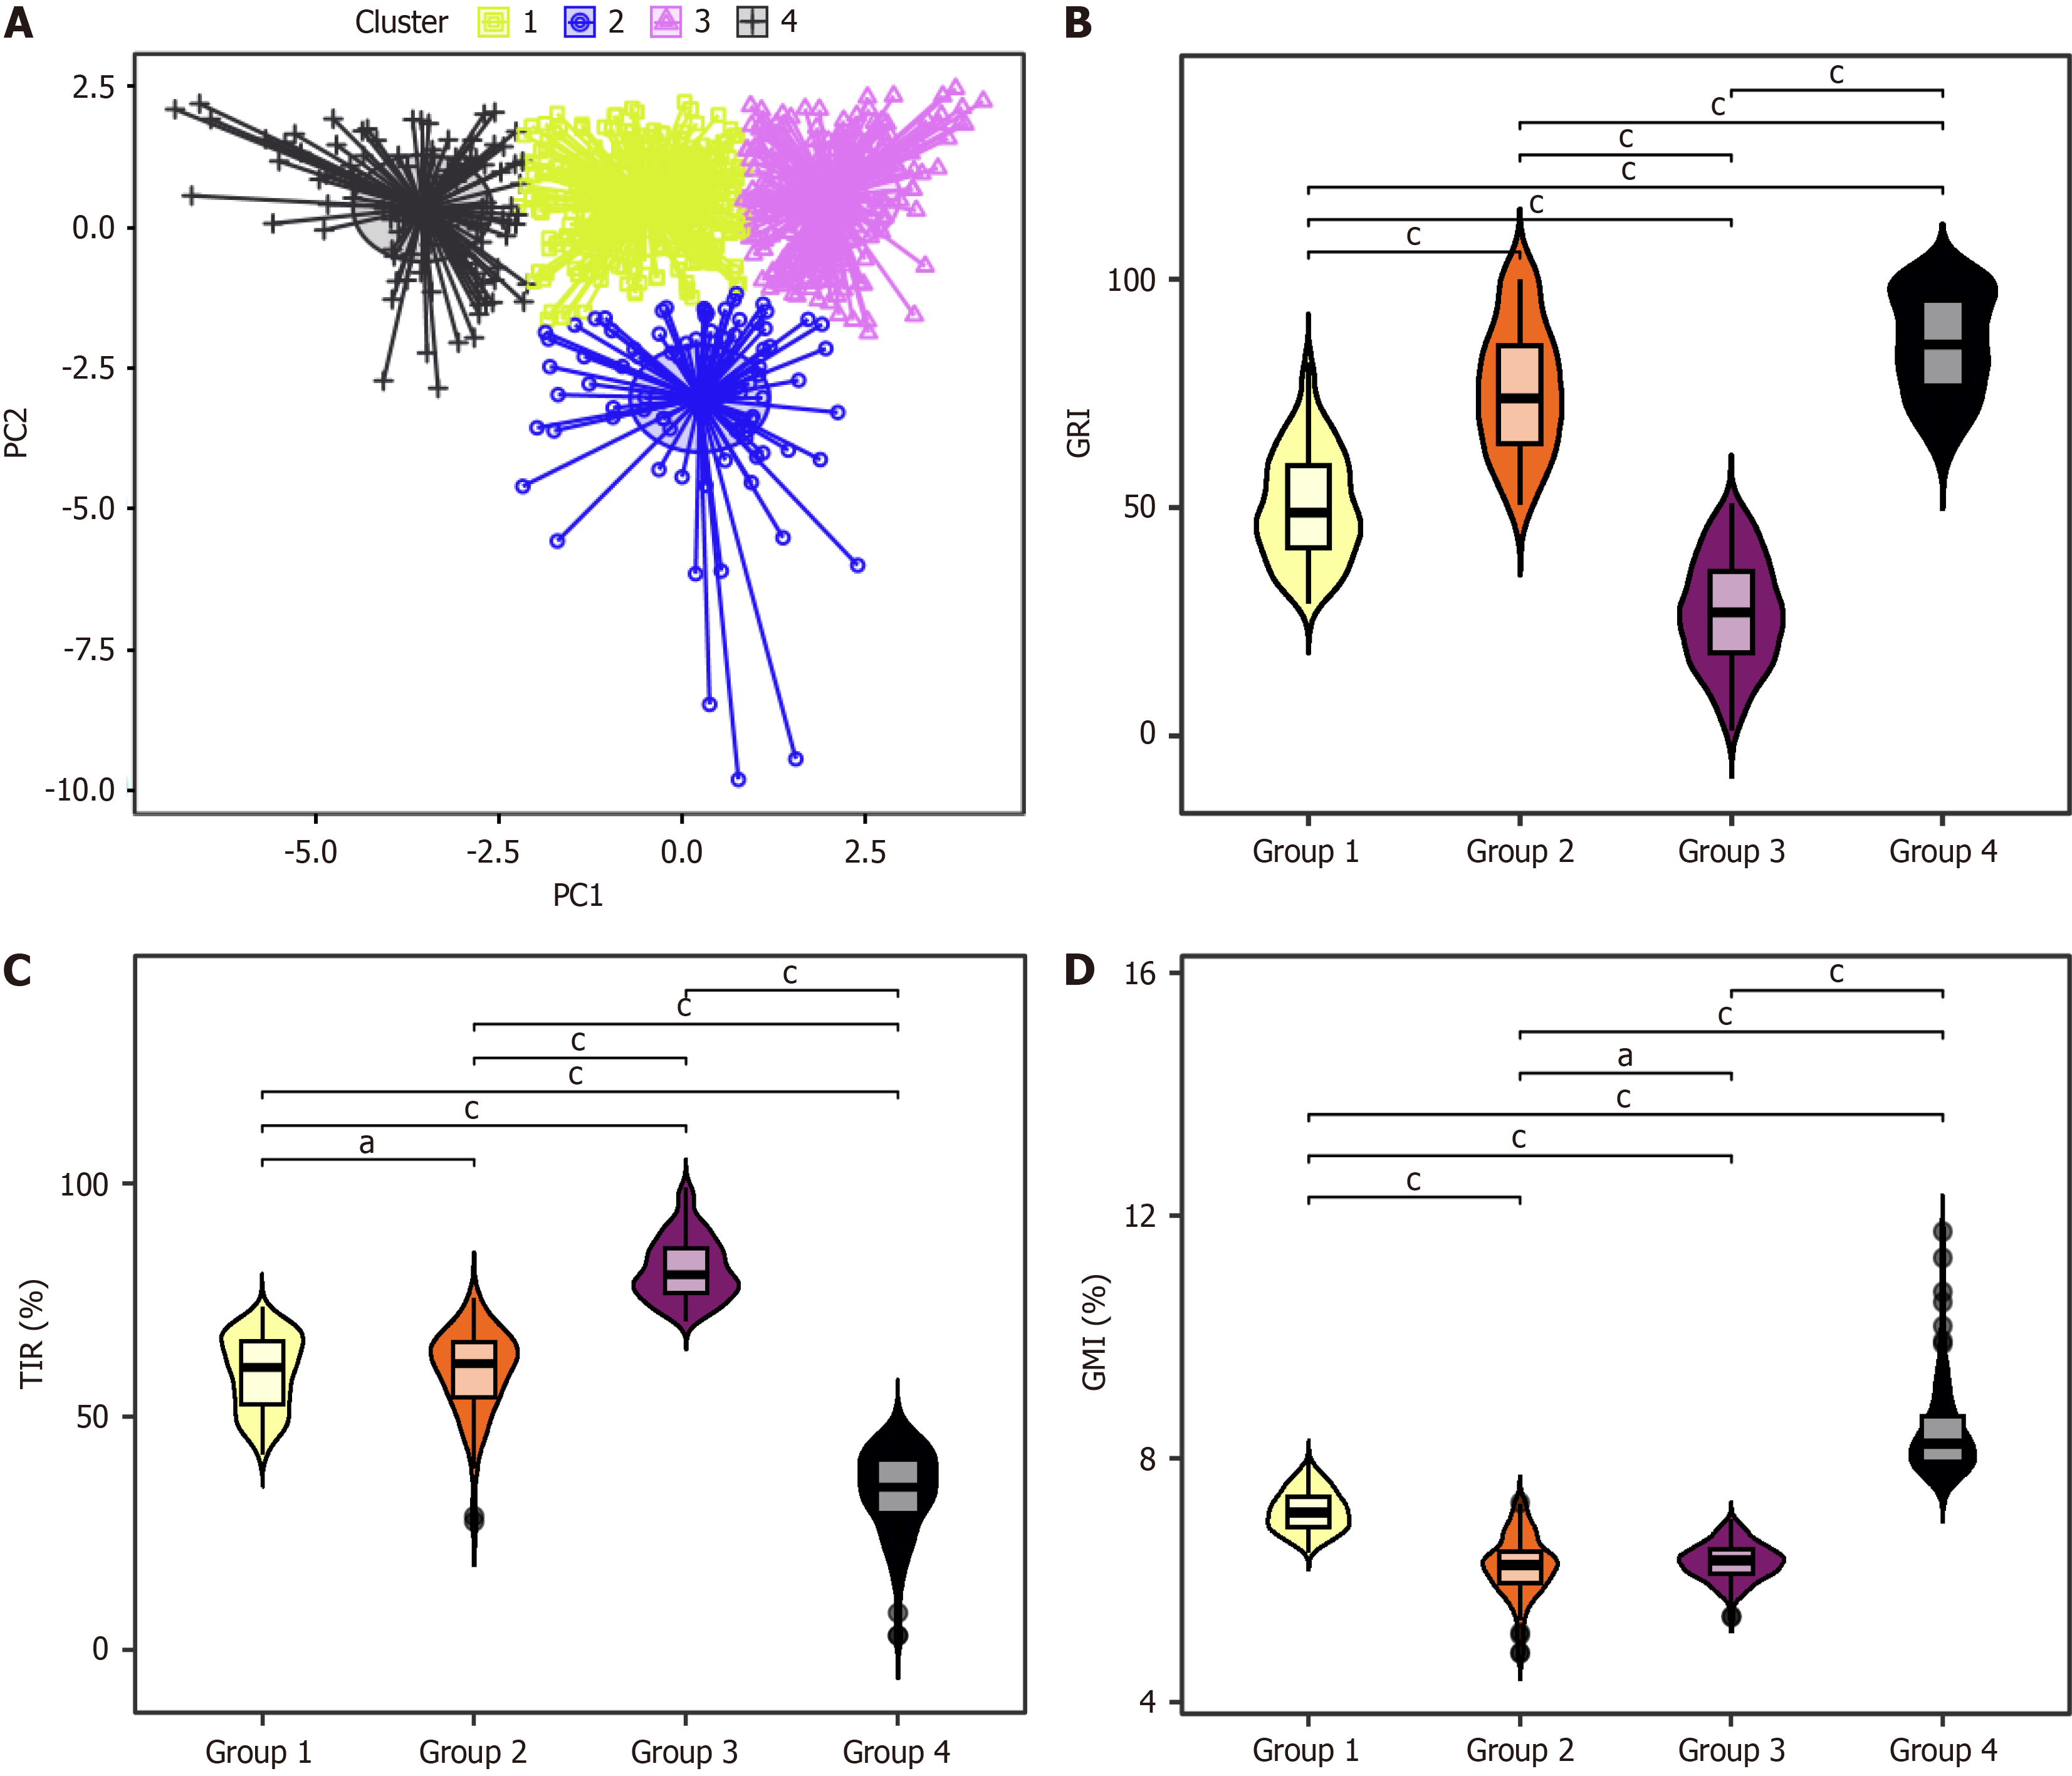
Figure 2 Illustration and characterization of glycaemic clusters identified by unsupervised hierarchical clustering on continuous glucose monitoring metrics.
A: Cluster analysis using glycemia risk index and the 7 parameters of ambulatory glucose profile; B-D: Violin plots were used to compare the glycemia risk index (B), time in range (C), glucose management indicator (D) levels across the groups. aP < 0.05; cP < 0.001. GRI: Glycemia risk index; TTR: Time in range; GMI: Glucose management indicator.
- Citation: He BB, Liu ZZ, Xu RY, Fan L, Guo R, Deng C, Xie YT, Zhou ZG, Li X. Glycated hemoglobin is not enough: The role of glycemia risk index for glycemic control assessment in type 1 diabetes. World J Diabetes 2025; 16(6): 104024
- URL: https://www.wjgnet.com/1948-9358/full/v16/i6/104024.htm
- DOI: https://dx.doi.org/10.4239/wjd.v16.i6.104024


