Copyright
©The Author(s) 2025.
World J Diabetes. Jun 15, 2025; 16(6): 104024
Published online Jun 15, 2025. doi: 10.4239/wjd.v16.i6.104024
Published online Jun 15, 2025. doi: 10.4239/wjd.v16.i6.104024
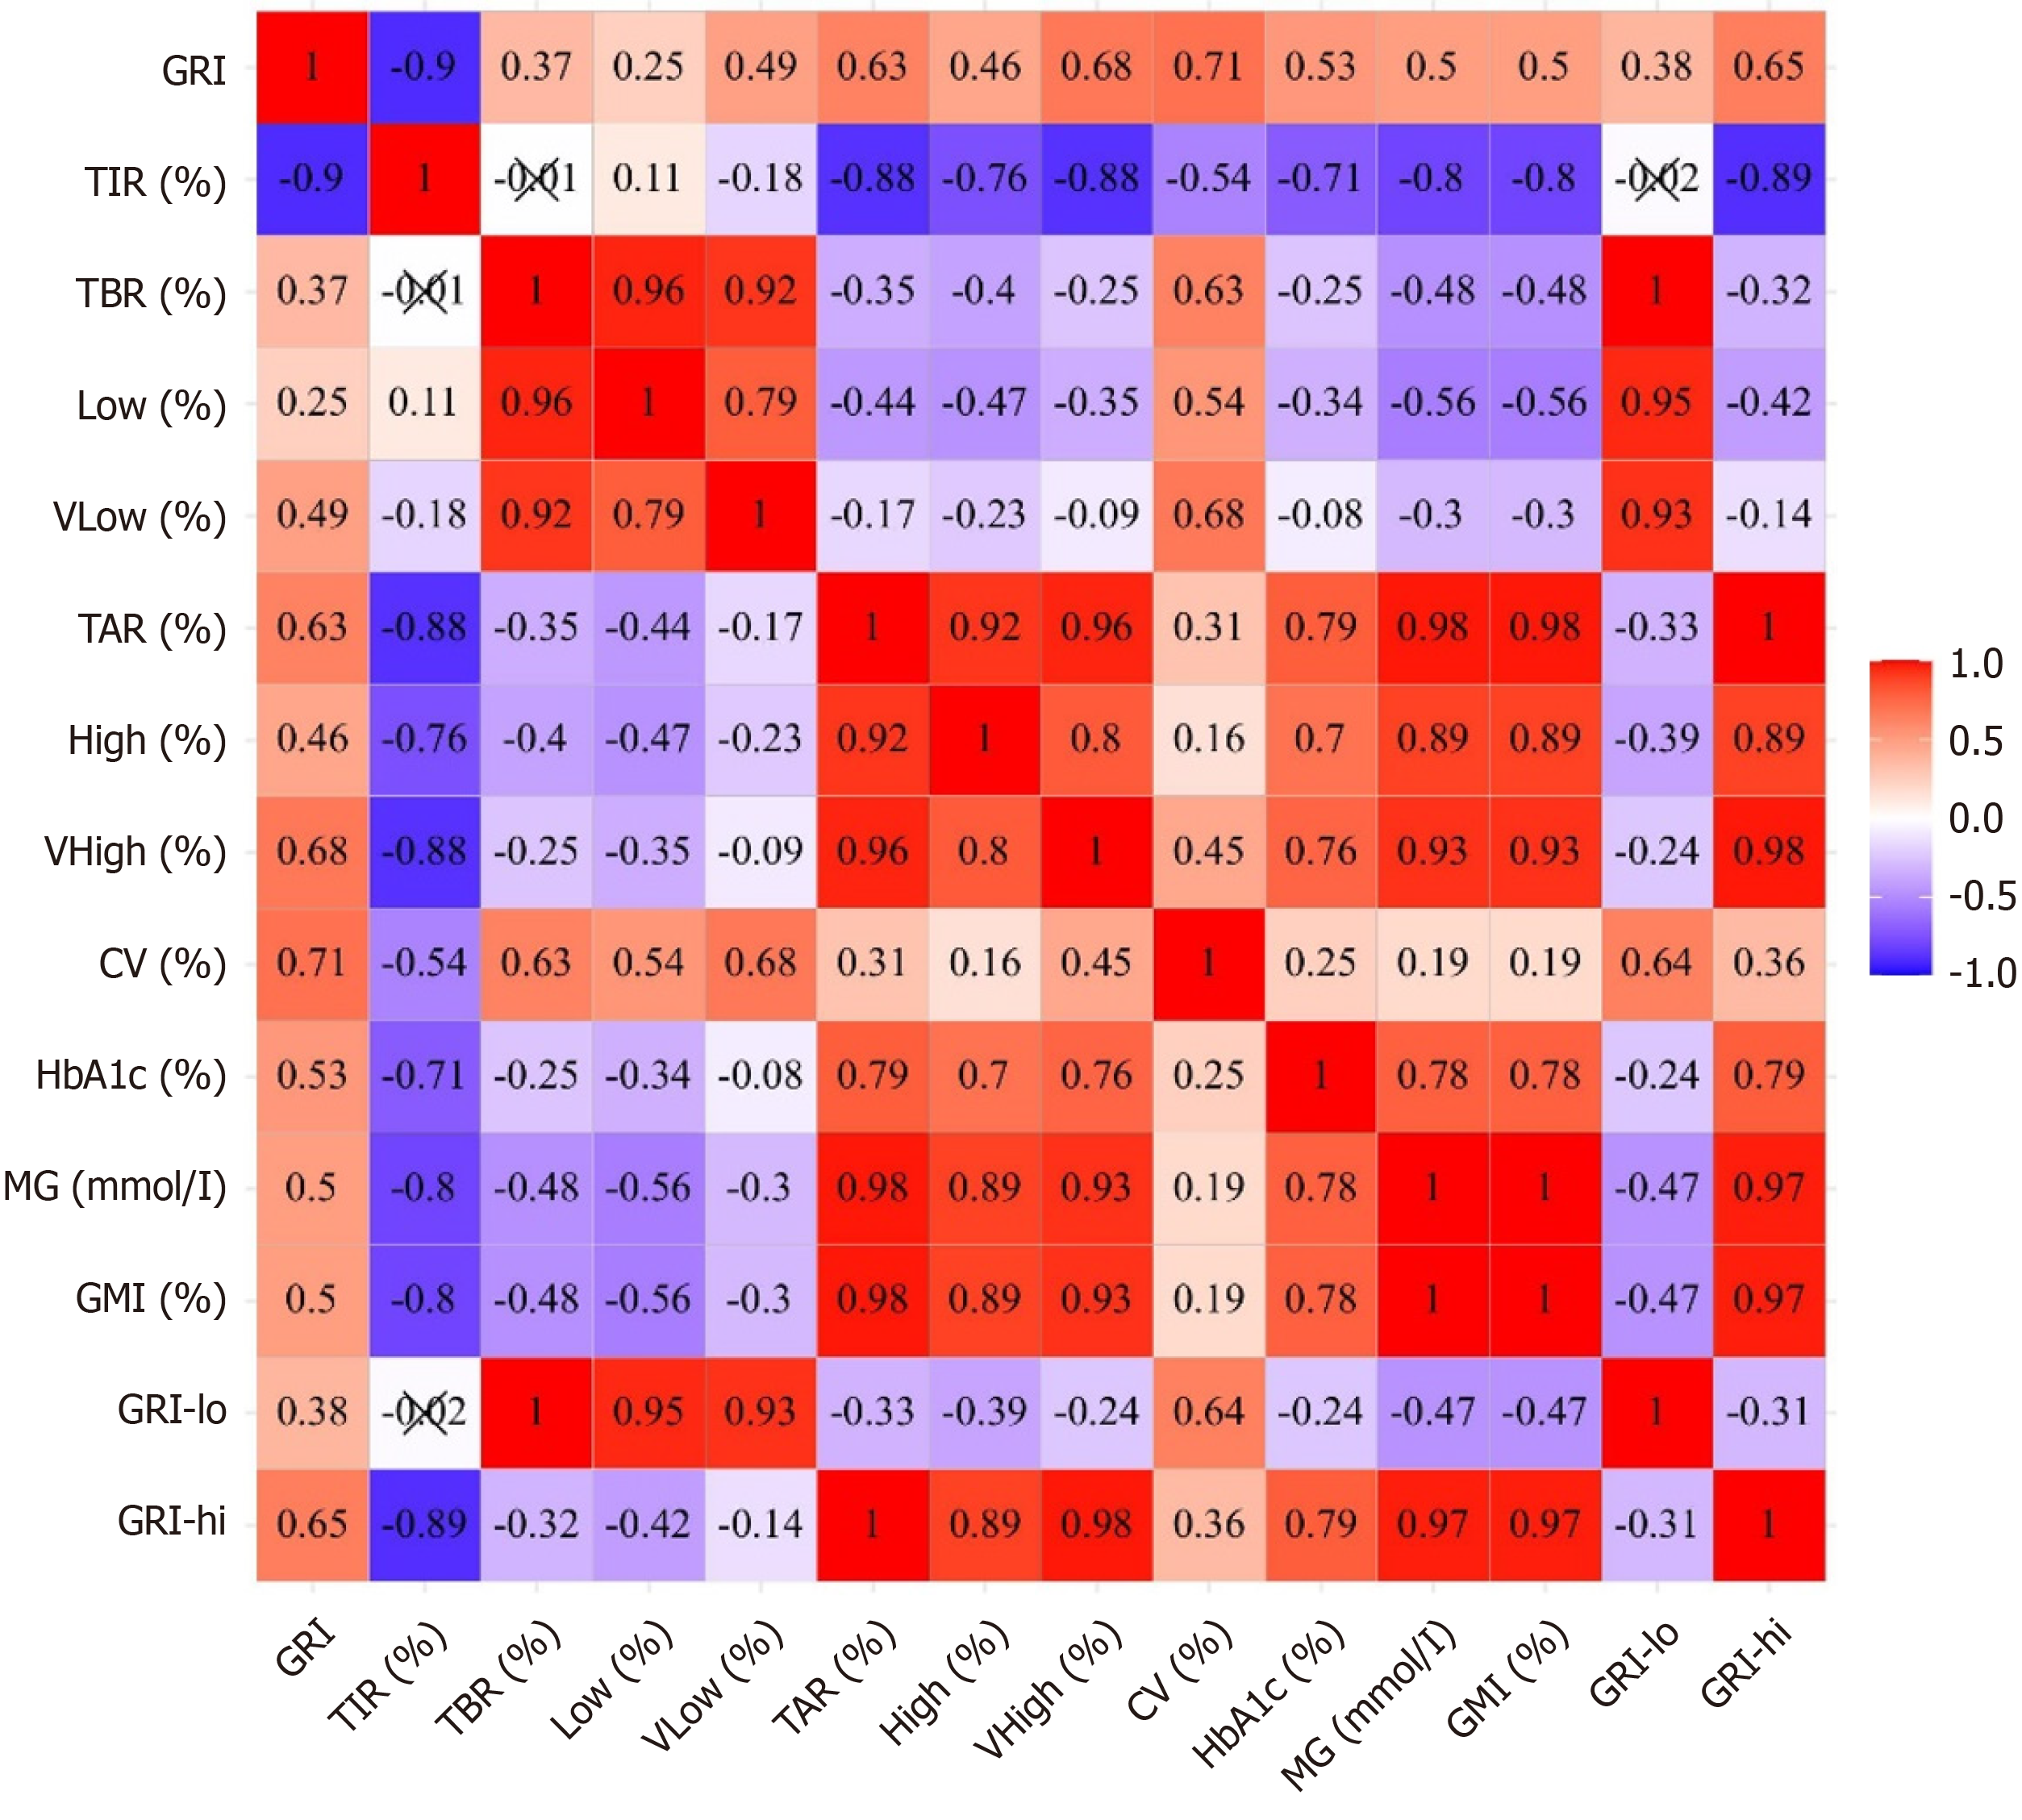
Figure 1 Relationship between the glycemia risk index and other continuous glucose monitoring metrics, glycated hemoglobin.
Correlations between pairs of metrics, where 1 indicates a strong correlation and -1 indicates a strong inverse correlation. GRI: Glycemia risk index; TIR: Time in range; TBR: Time below range; Low: Low-glucose hypoglycemia (glucose level: 3.0 mmol/L to < 3.9 mmol/L); VLow: Very-low-glucose hypoglycemia (glucose level: < 3.0 mmol/L); TAR: Time above range; High: High-glucose hyperglycemia (glucose level: 10.0 mmol/L to 13.9 mmol/L); VHigh: Very-high-glucose hyperglycemia (glucose level: > 13.9 mmol/L); CV: Coefficient of variation; MG: Mean glucose; HbA1c: Glycated hemoglobin; GMI: Glucose management indicator; GRI-lo: Hypoglycemia component of glycemia risk index; GRI-hi: The hyperglycemia component of glycemia risk index.
- Citation: He BB, Liu ZZ, Xu RY, Fan L, Guo R, Deng C, Xie YT, Zhou ZG, Li X. Glycated hemoglobin is not enough: The role of glycemia risk index for glycemic control assessment in type 1 diabetes. World J Diabetes 2025; 16(6): 104024
- URL: https://www.wjgnet.com/1948-9358/full/v16/i6/104024.htm
- DOI: https://dx.doi.org/10.4239/wjd.v16.i6.104024


