Copyright
©The Author(s) 2025.
World J Diabetes. Jun 15, 2025; 16(6): 103370
Published online Jun 15, 2025. doi: 10.4239/wjd.v16.i6.103370
Published online Jun 15, 2025. doi: 10.4239/wjd.v16.i6.103370
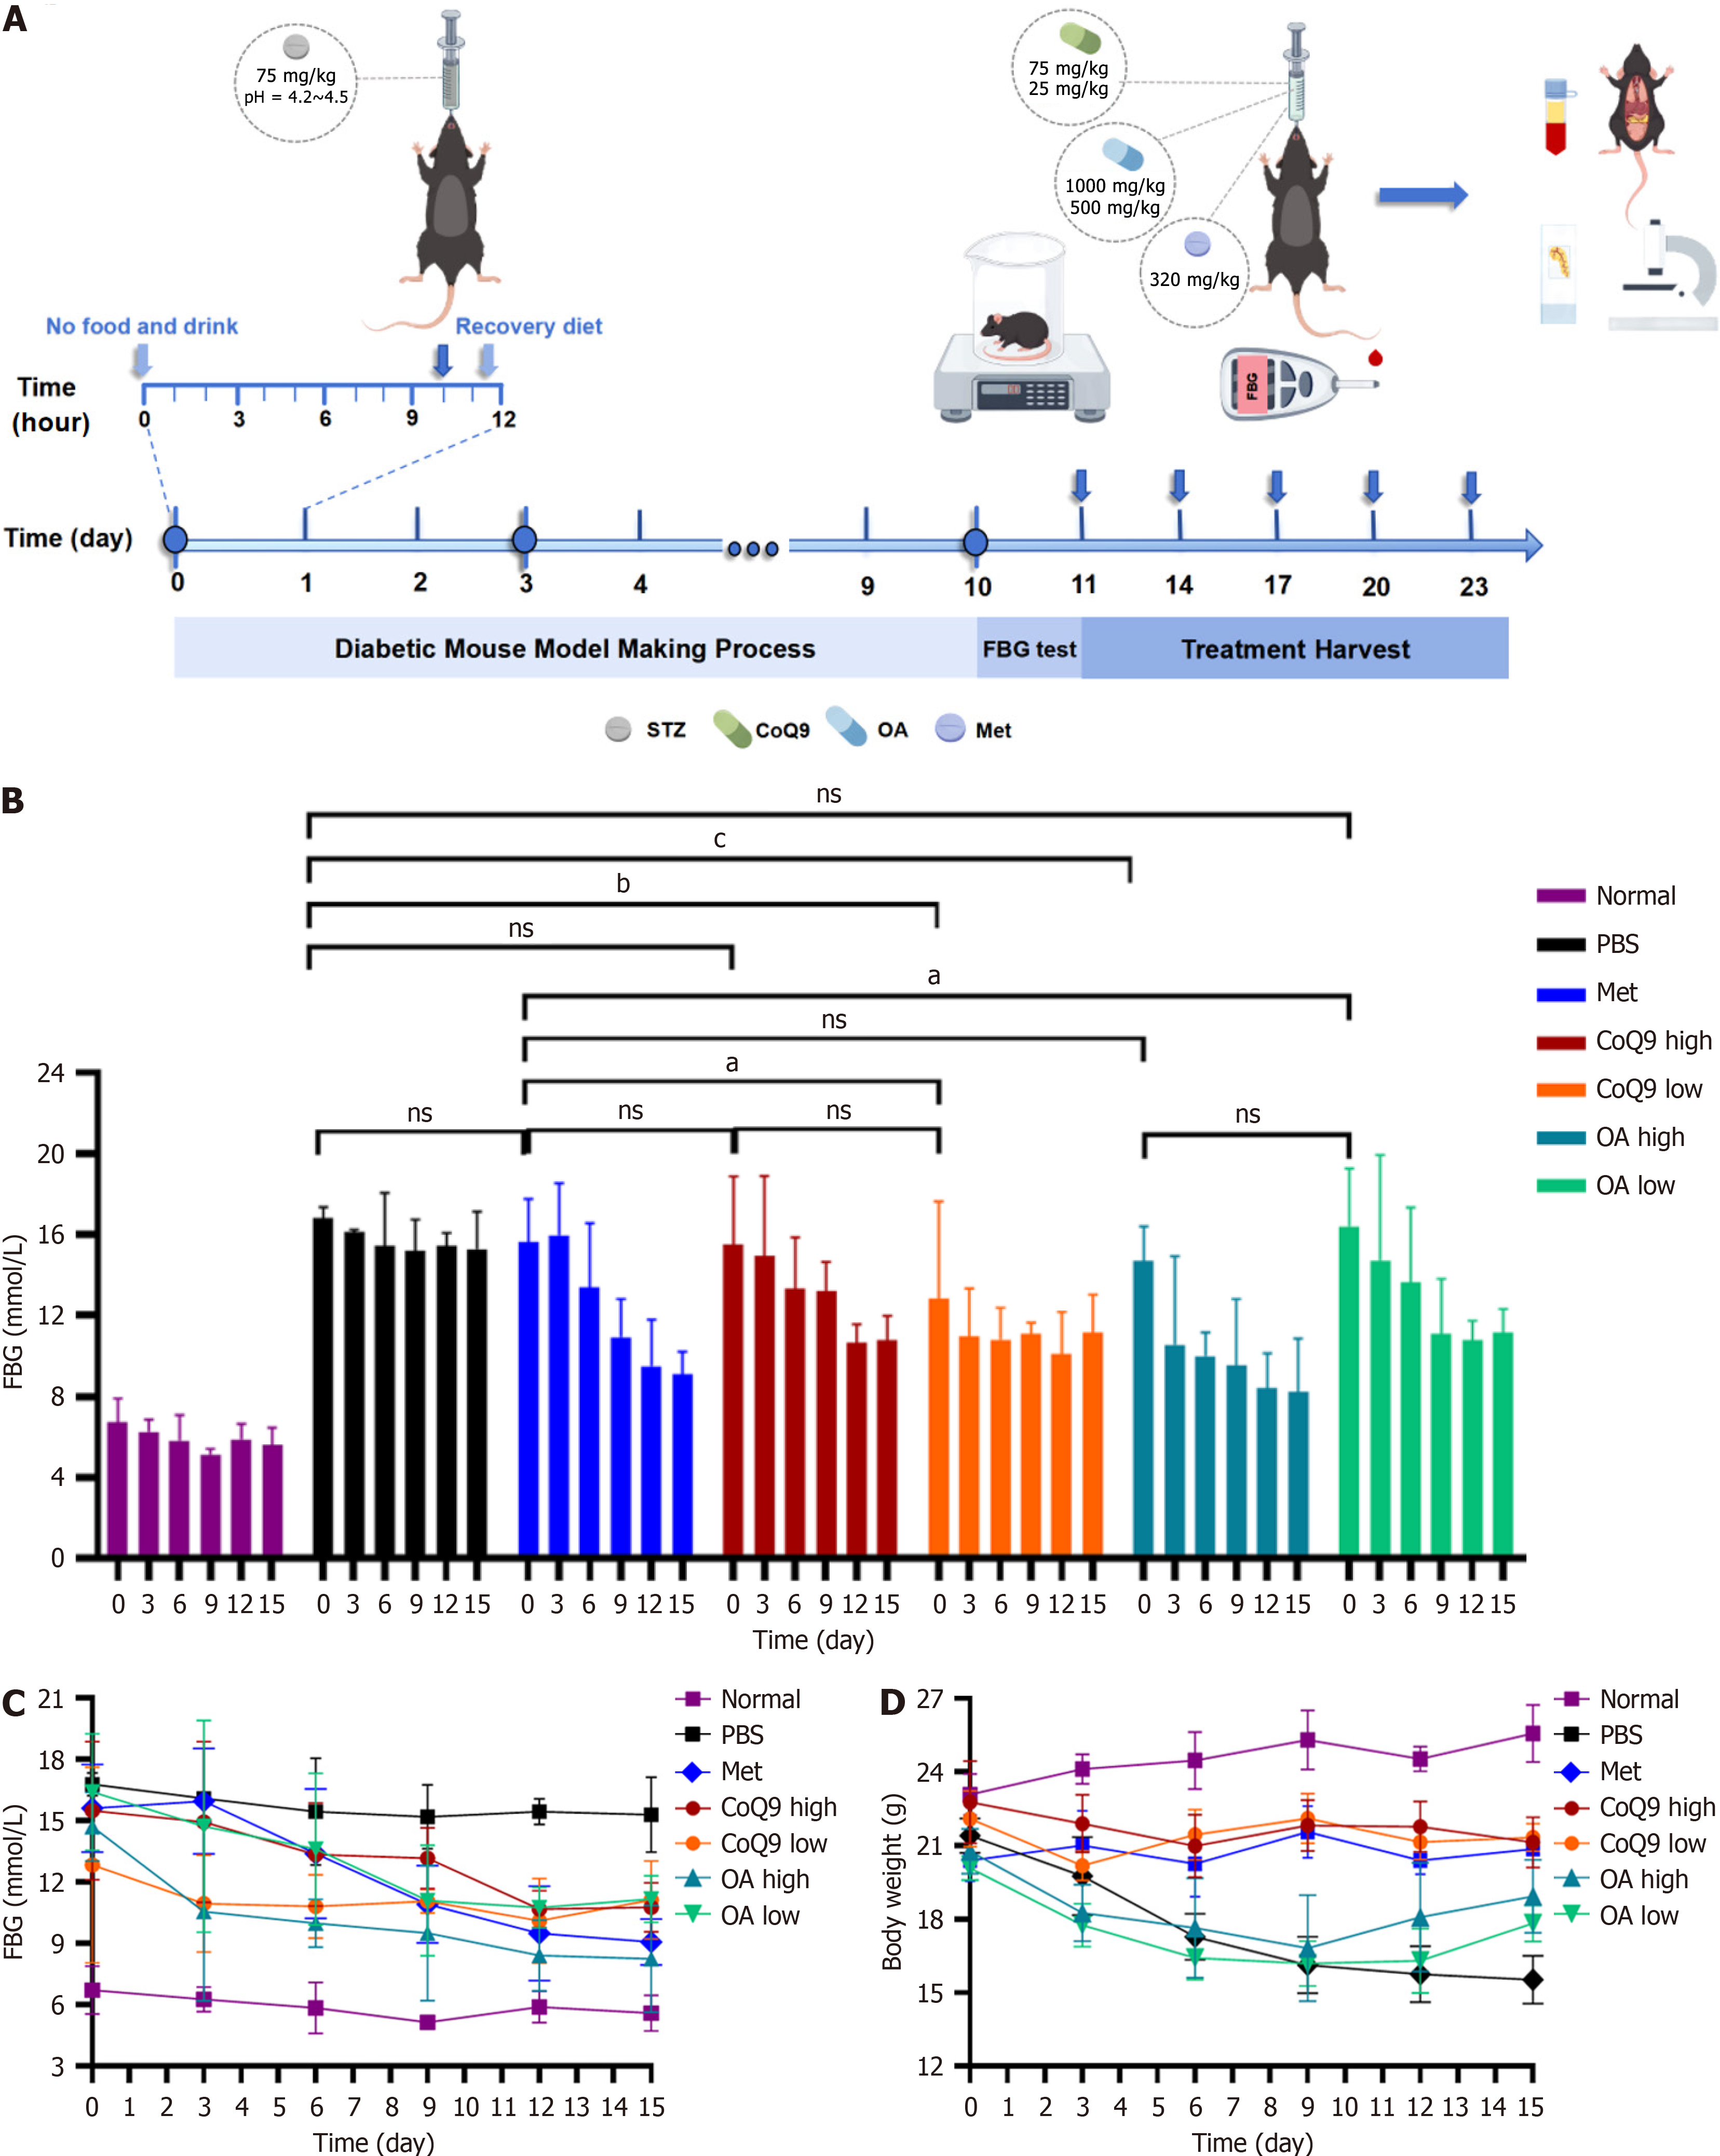
Figure 8 Changes in blood glucose and body weight during medication administration in diabetic mice.
A: Diabetic mouse treatment model; B: Bar chart of changes in blood glucose levels; C: Line graph of changes in blood glucose levels; D: Chart of changes in body weight. nsP > 0.05. aP < 0.05. bP < 0.01. cP < 0.001. CoQ9: Coenzyme Q9; FBG: Fasting blood glucose; Met: Metformin; OA: Oleic acid; PBS: Phosphate-buffered saline; pH: Potential of hydrogen; STZ: Streptozotocin.
- Citation: Xu WY, Zhou WT, Luo JZ, Jiang YY, Zhang K, Zhang SY, Liu PS, Wei HY, Huang YQ. Lipid metabolism of Acetobacter pasteurianus and its main components with hypoglycemic effects. World J Diabetes 2025; 16(6): 103370
- URL: https://www.wjgnet.com/1948-9358/full/v16/i6/103370.htm
- DOI: https://dx.doi.org/10.4239/wjd.v16.i6.103370


