Copyright
©The Author(s) 2025.
World J Diabetes. Jun 15, 2025; 16(6): 103370
Published online Jun 15, 2025. doi: 10.4239/wjd.v16.i6.103370
Published online Jun 15, 2025. doi: 10.4239/wjd.v16.i6.103370
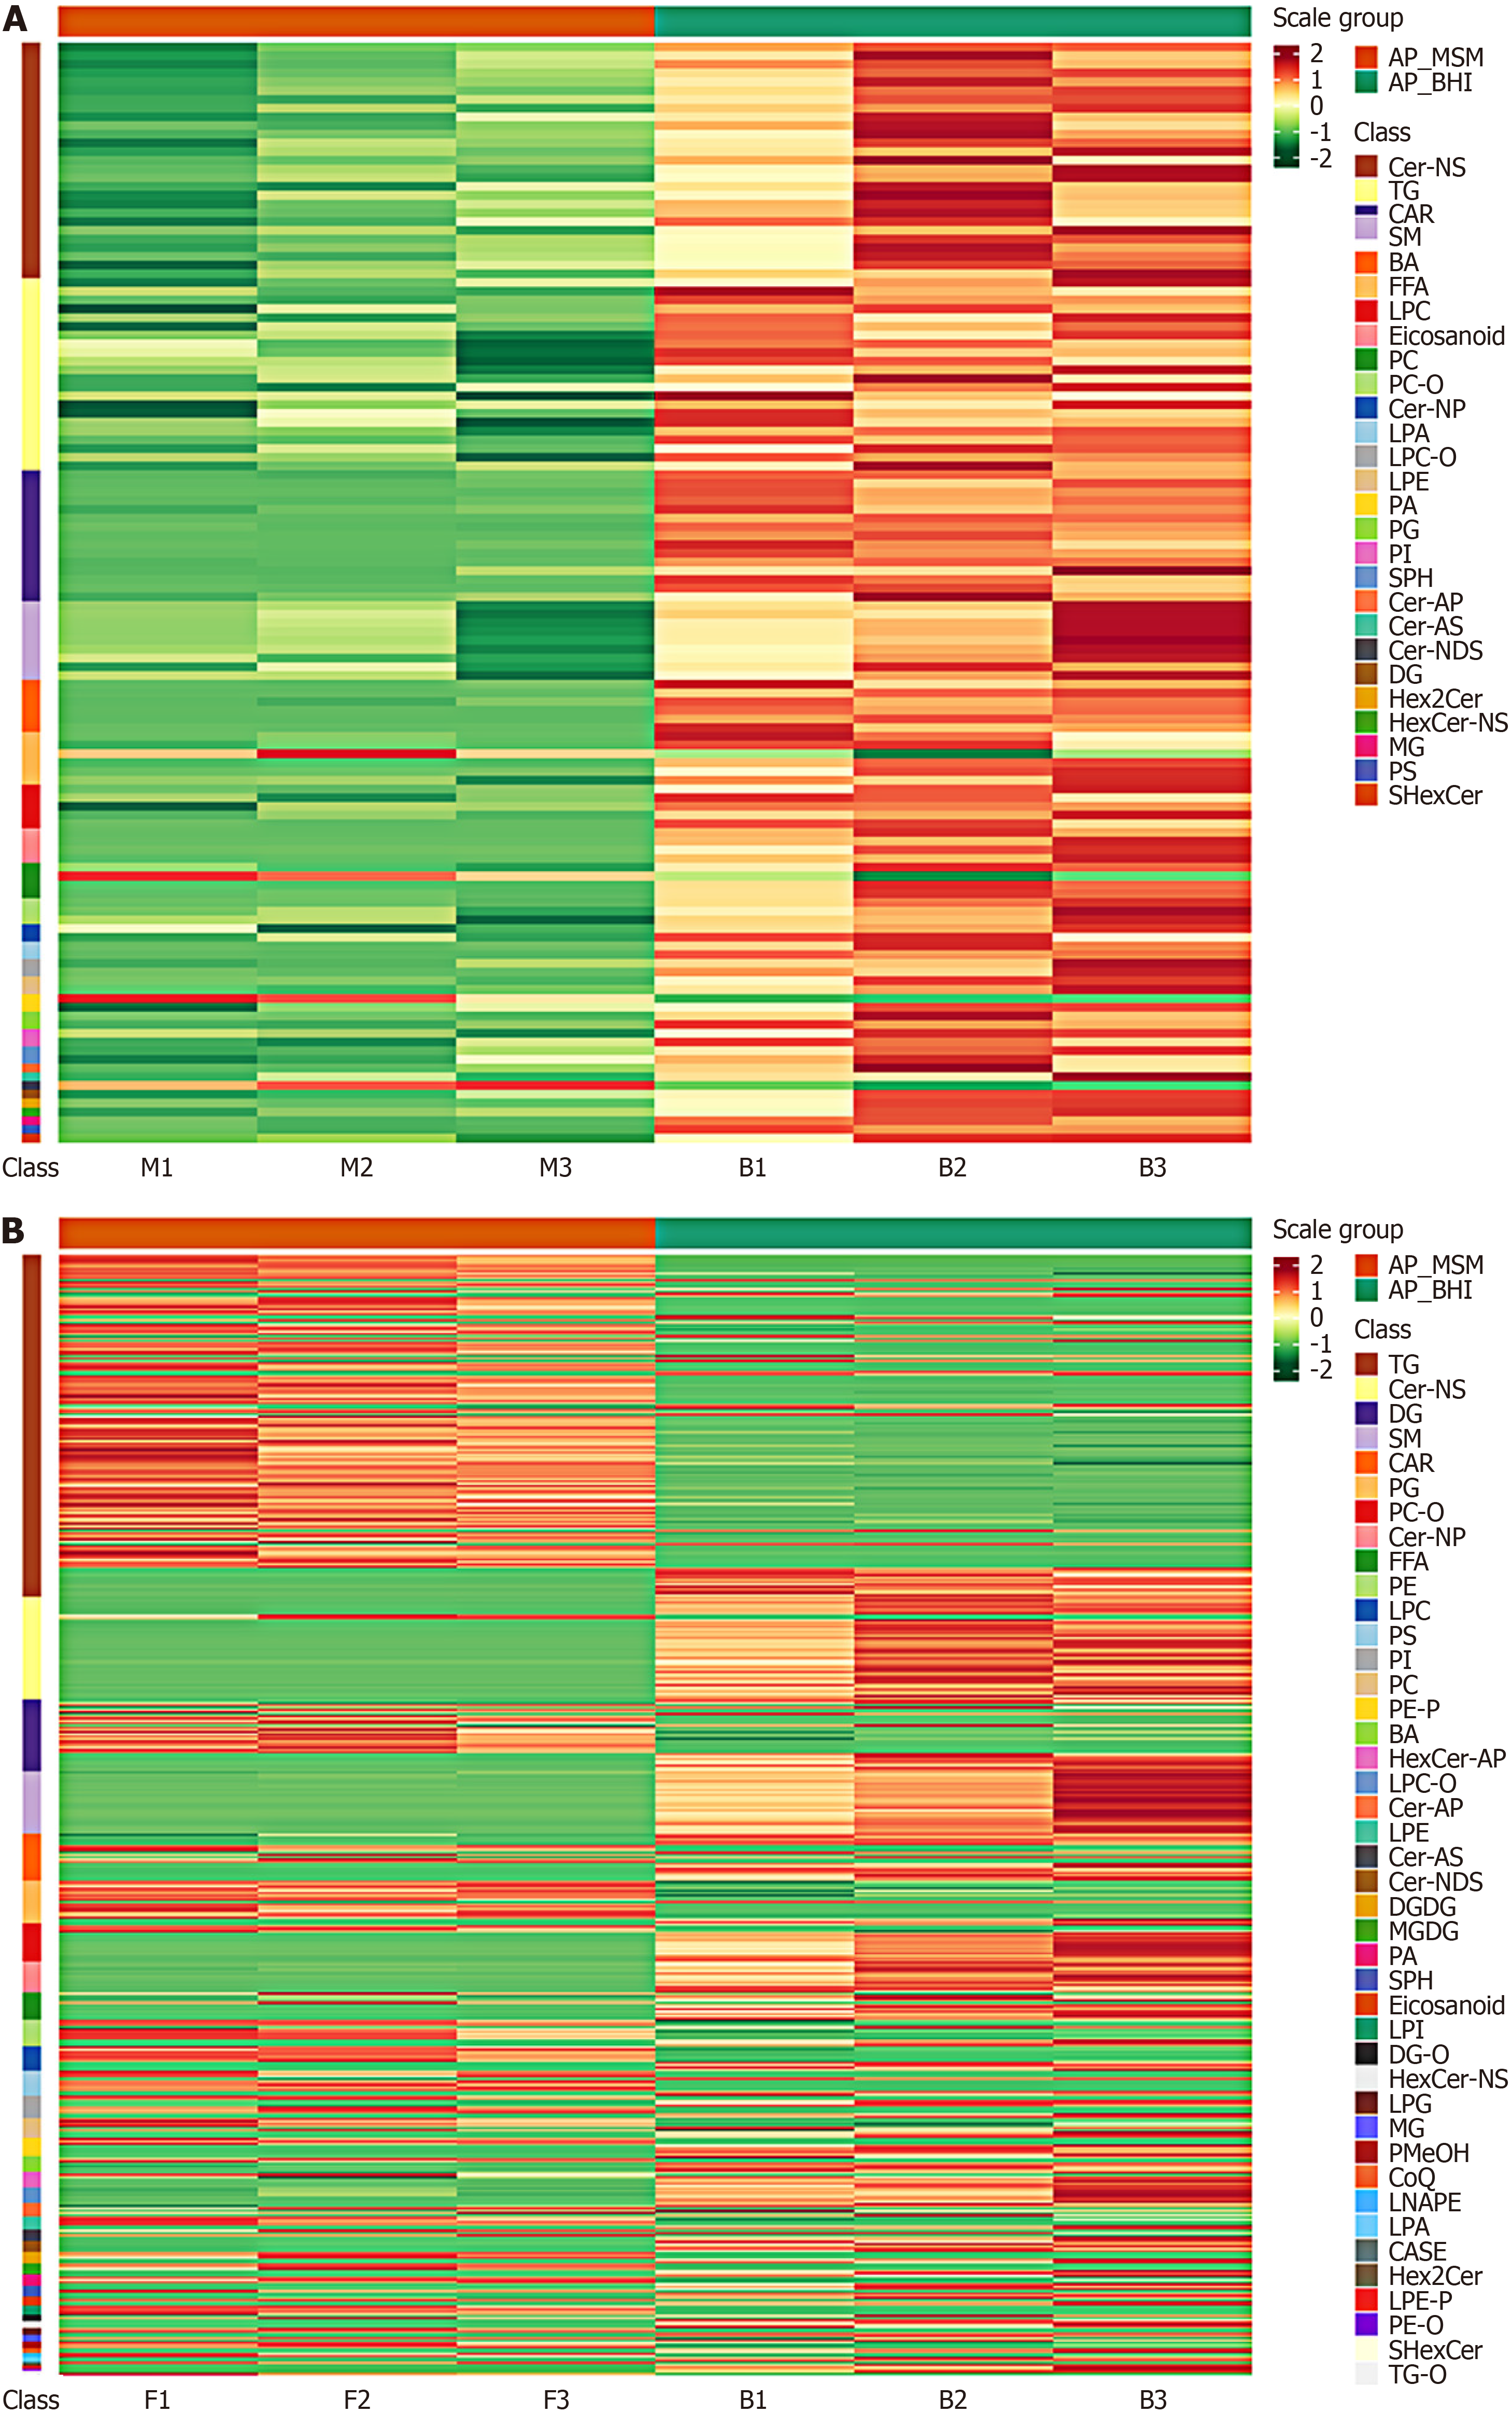
Figure 1 Cluster heatmap of differential lipids between groups.
A: Mineral salt medium (MSM) vs brain heart infusion (BHI); B: FF (i.e. rich in chromium and zinc group) vs BHI. Metabolomics testing was performed on Acetobacter pasteurianus from BHI culture, chromium-rich zinc-rich culture, and MSM culture. After normalization of different contents, red indicates high content and green indicates low content. In the figure, the cluster lines on the left represent lipid clustering, and those on the top represent sample clustering. AP: Alkylphospholipid; BA: Bile acid; CAR: Cardiolipin; CASE: Sitosterol acetate; Cer-AP: Ceramide-1-phosphate; Cer-AS: Ceramide-1-sulfate; Cer-NDS: Ceramide-N-phosphoethanolamine; Cer-NP: Ceramide-N-phosphocholine; CoQ: Coenzyme Q; DG: Diacylglycerol; DGDG: Digalactosyldiacyl glycerol; FFA: Free fatty acid; LPA: Lysophosphatidic acid; LPC-O: Lysophosphatidyl choline-plasmalogen; LPE: Lysophosphatidyl ethanolamine; LPE-P: Lysophosphatidyl ethanolamine-plasmalogen; LPG: Lysophosphatidyl glycerol; LPI: Lysophosphatidyl inositol; MG: Monoacylglycerol; MGDG: Monogalactosyldiacylglycerol; NS: N-sphingomyelin; PA: Phosphatidic acid; PC: Phosphatidylcholine; PC-O: Plasmalogen phosphatidylcholine; PE-O: Plasmalogen phosphatidylethanolamine; PE-P: Phosphatidylethanolamine-plasmalogen; PG: Phosphatidylglycerol; PI: Phosphatidylinositol; PMeOH: Phosphatidyl methanol; PS: Phosphatidylserine; SM: Sphingomyelin; SPH: Sphingosine; TG: Triacylglycerol; TG-O: Triacylglycerol-plasmalogen.
- Citation: Xu WY, Zhou WT, Luo JZ, Jiang YY, Zhang K, Zhang SY, Liu PS, Wei HY, Huang YQ. Lipid metabolism of Acetobacter pasteurianus and its main components with hypoglycemic effects. World J Diabetes 2025; 16(6): 103370
- URL: https://www.wjgnet.com/1948-9358/full/v16/i6/103370.htm
- DOI: https://dx.doi.org/10.4239/wjd.v16.i6.103370


