Copyright
©The Author(s) 2025.
World J Diabetes. Jun 15, 2025; 16(6): 102727
Published online Jun 15, 2025. doi: 10.4239/wjd.v16.i6.102727
Published online Jun 15, 2025. doi: 10.4239/wjd.v16.i6.102727
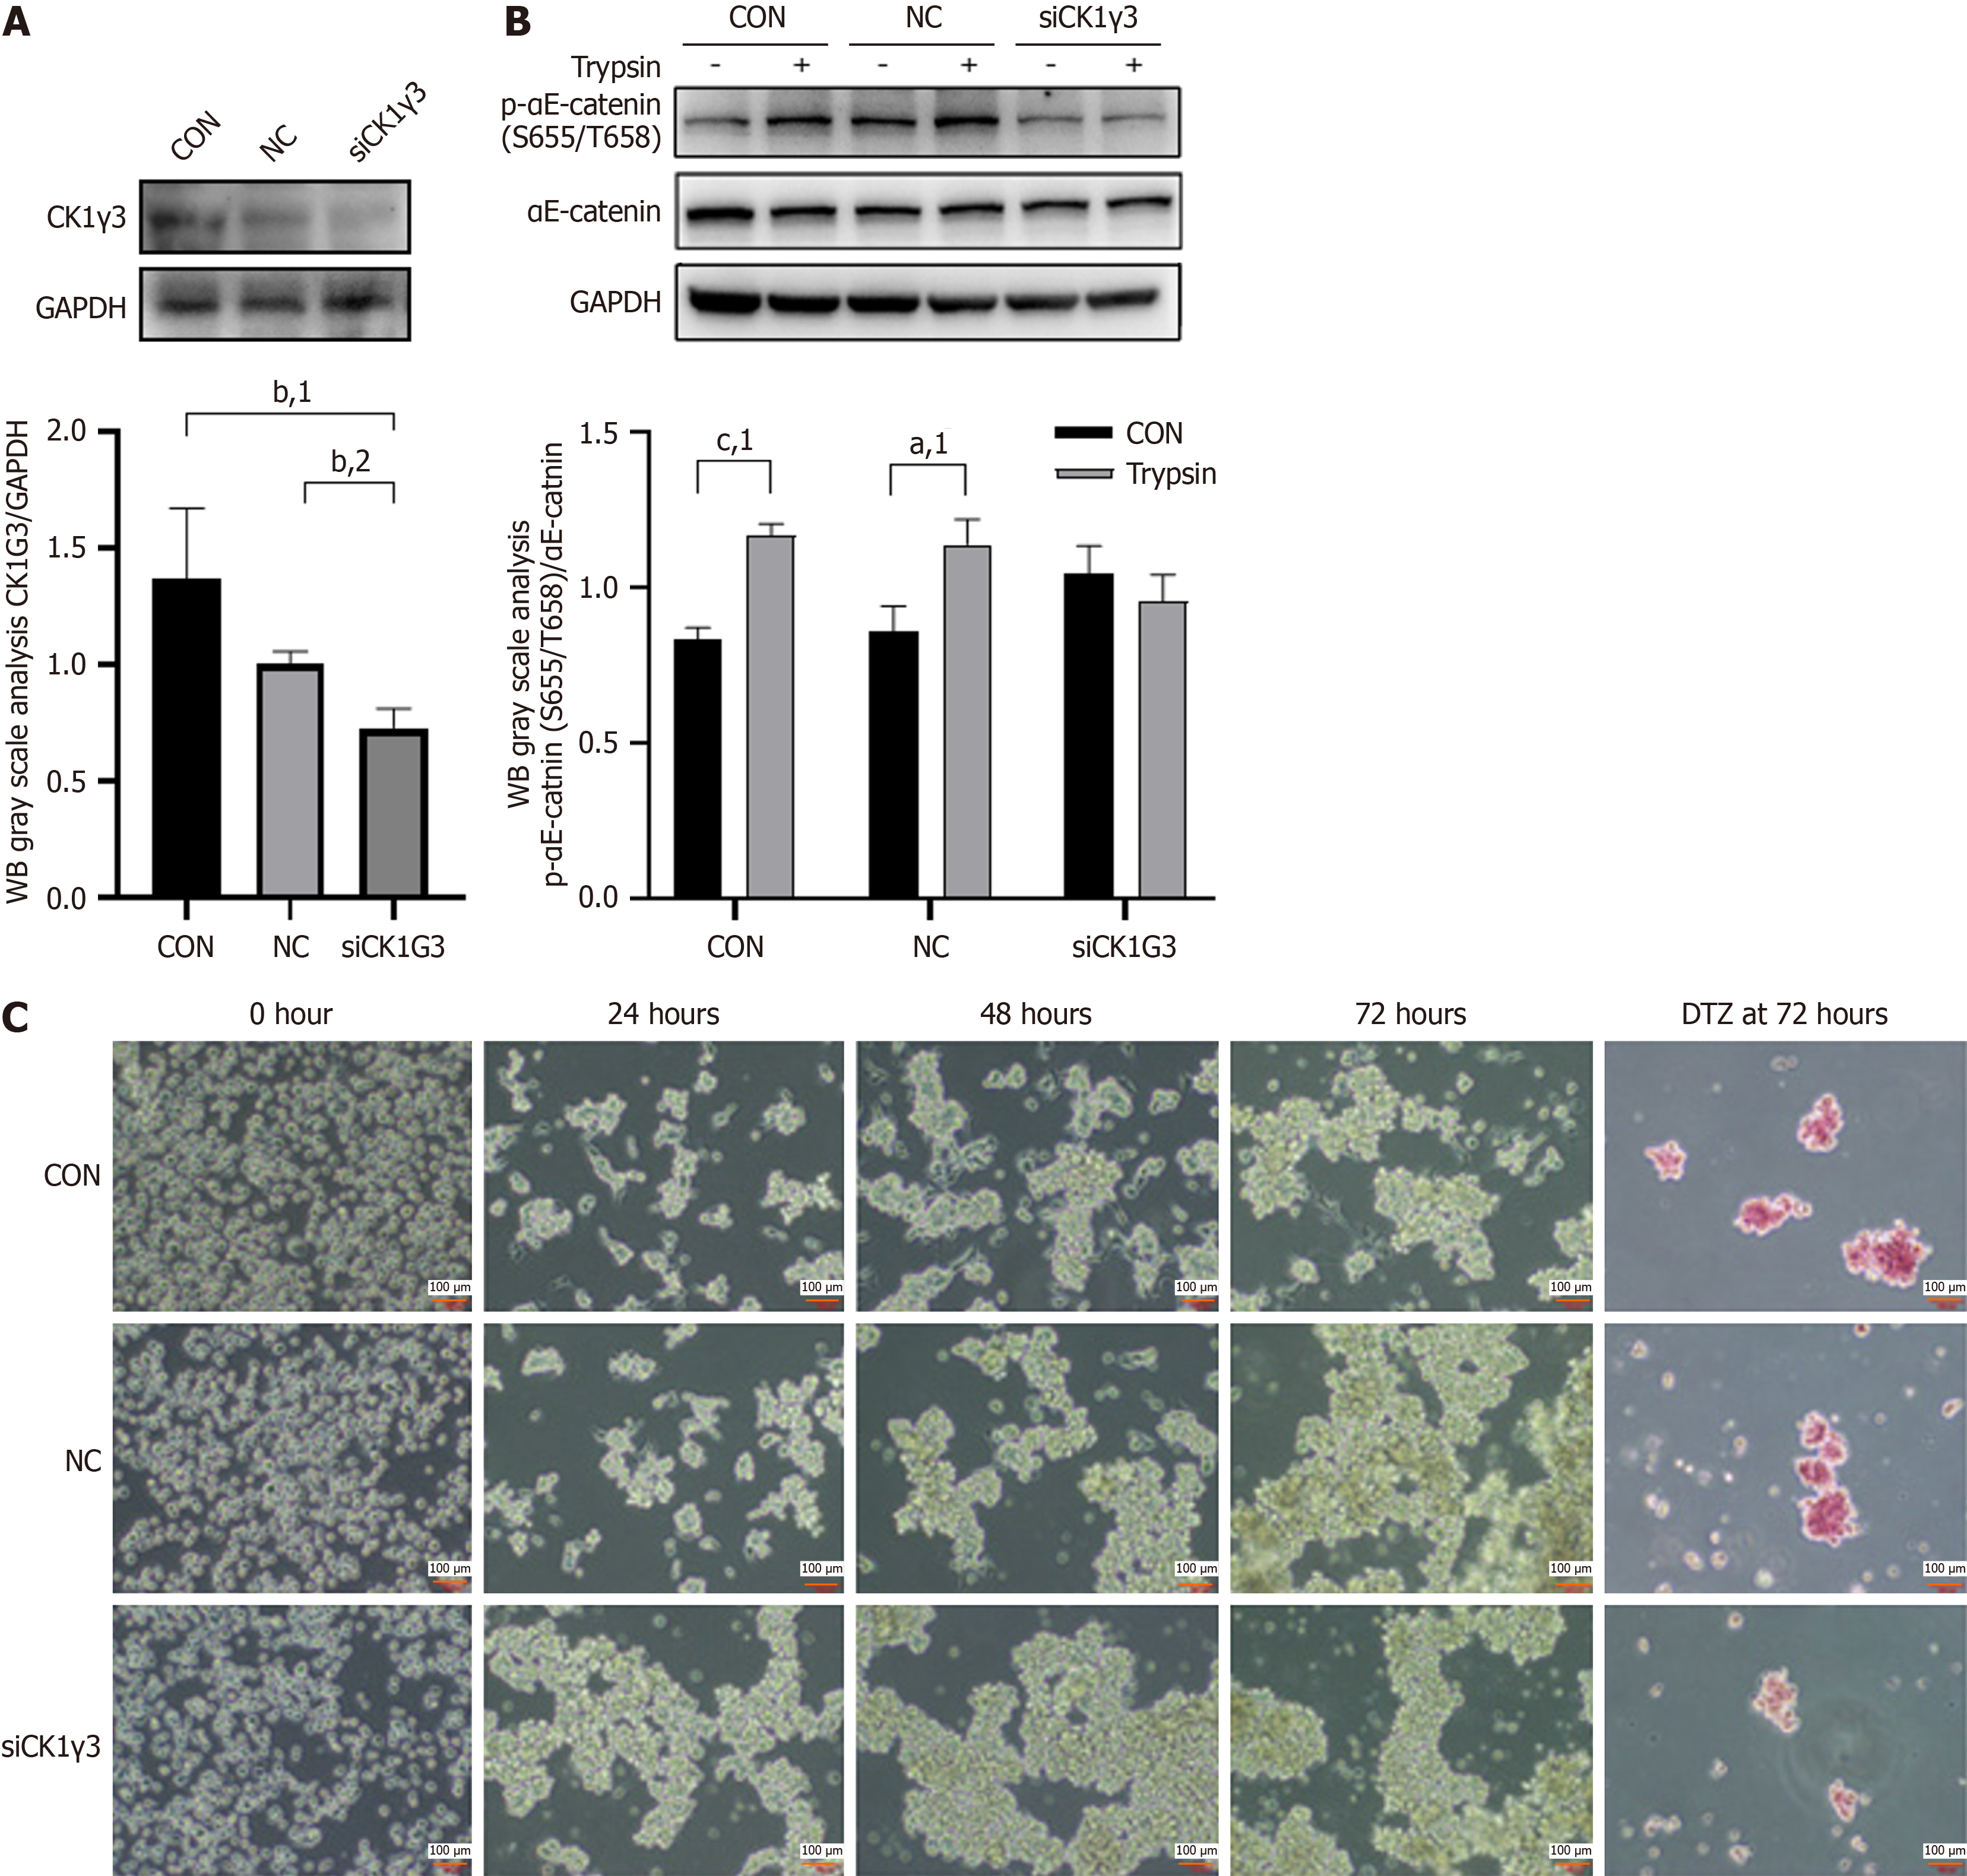
Figure 6 Casein kinase-1γ3 participated in the αE-catenin (Ser655/Thr658) phosphorylation mediated by trypsin.
A: Representative western blot (WB) images reflecting the efficiency of small interfering RNA knockdown of casein kinase-1γ3 (CK1γ3); B: Representative WB images reflecting protein expression of phospho-αE-catenin (Ser655/Thr658) in CK1γ3 knockdown cells and differences in trypsin-mediated αE-catenin (Ser655/Thr658) phosphorylation before and after knockdown; C: Representative images of knockout (KO) cells at five time points after digestion with trypsin and diphenylterazine (DTZ) staining of cell clusters formed at 72 hours before and after CK1γ3 knockdown, magnification 10 ×. aP < 0.05. bP < 0.01. cP < 0.001. 1P calculated vs control. 2P calculated vs negative control (NC). GAPDH: Glyceraldehyde-3-phosphate dehydrogenase; CON: Control.
- Citation: Gao L, Lai JS, Chen H, Qian LX, Hong WJ, Li LC. Mechanism of trypsin-mediated differentiation of pancreatic progenitor cells into functional islet-like clusters. World J Diabetes 2025; 16(6): 102727
- URL: https://www.wjgnet.com/1948-9358/full/v16/i6/102727.htm
- DOI: https://dx.doi.org/10.4239/wjd.v16.i6.102727


