Copyright
©The Author(s) 2025.
World J Diabetes. Jun 15, 2025; 16(6): 102727
Published online Jun 15, 2025. doi: 10.4239/wjd.v16.i6.102727
Published online Jun 15, 2025. doi: 10.4239/wjd.v16.i6.102727
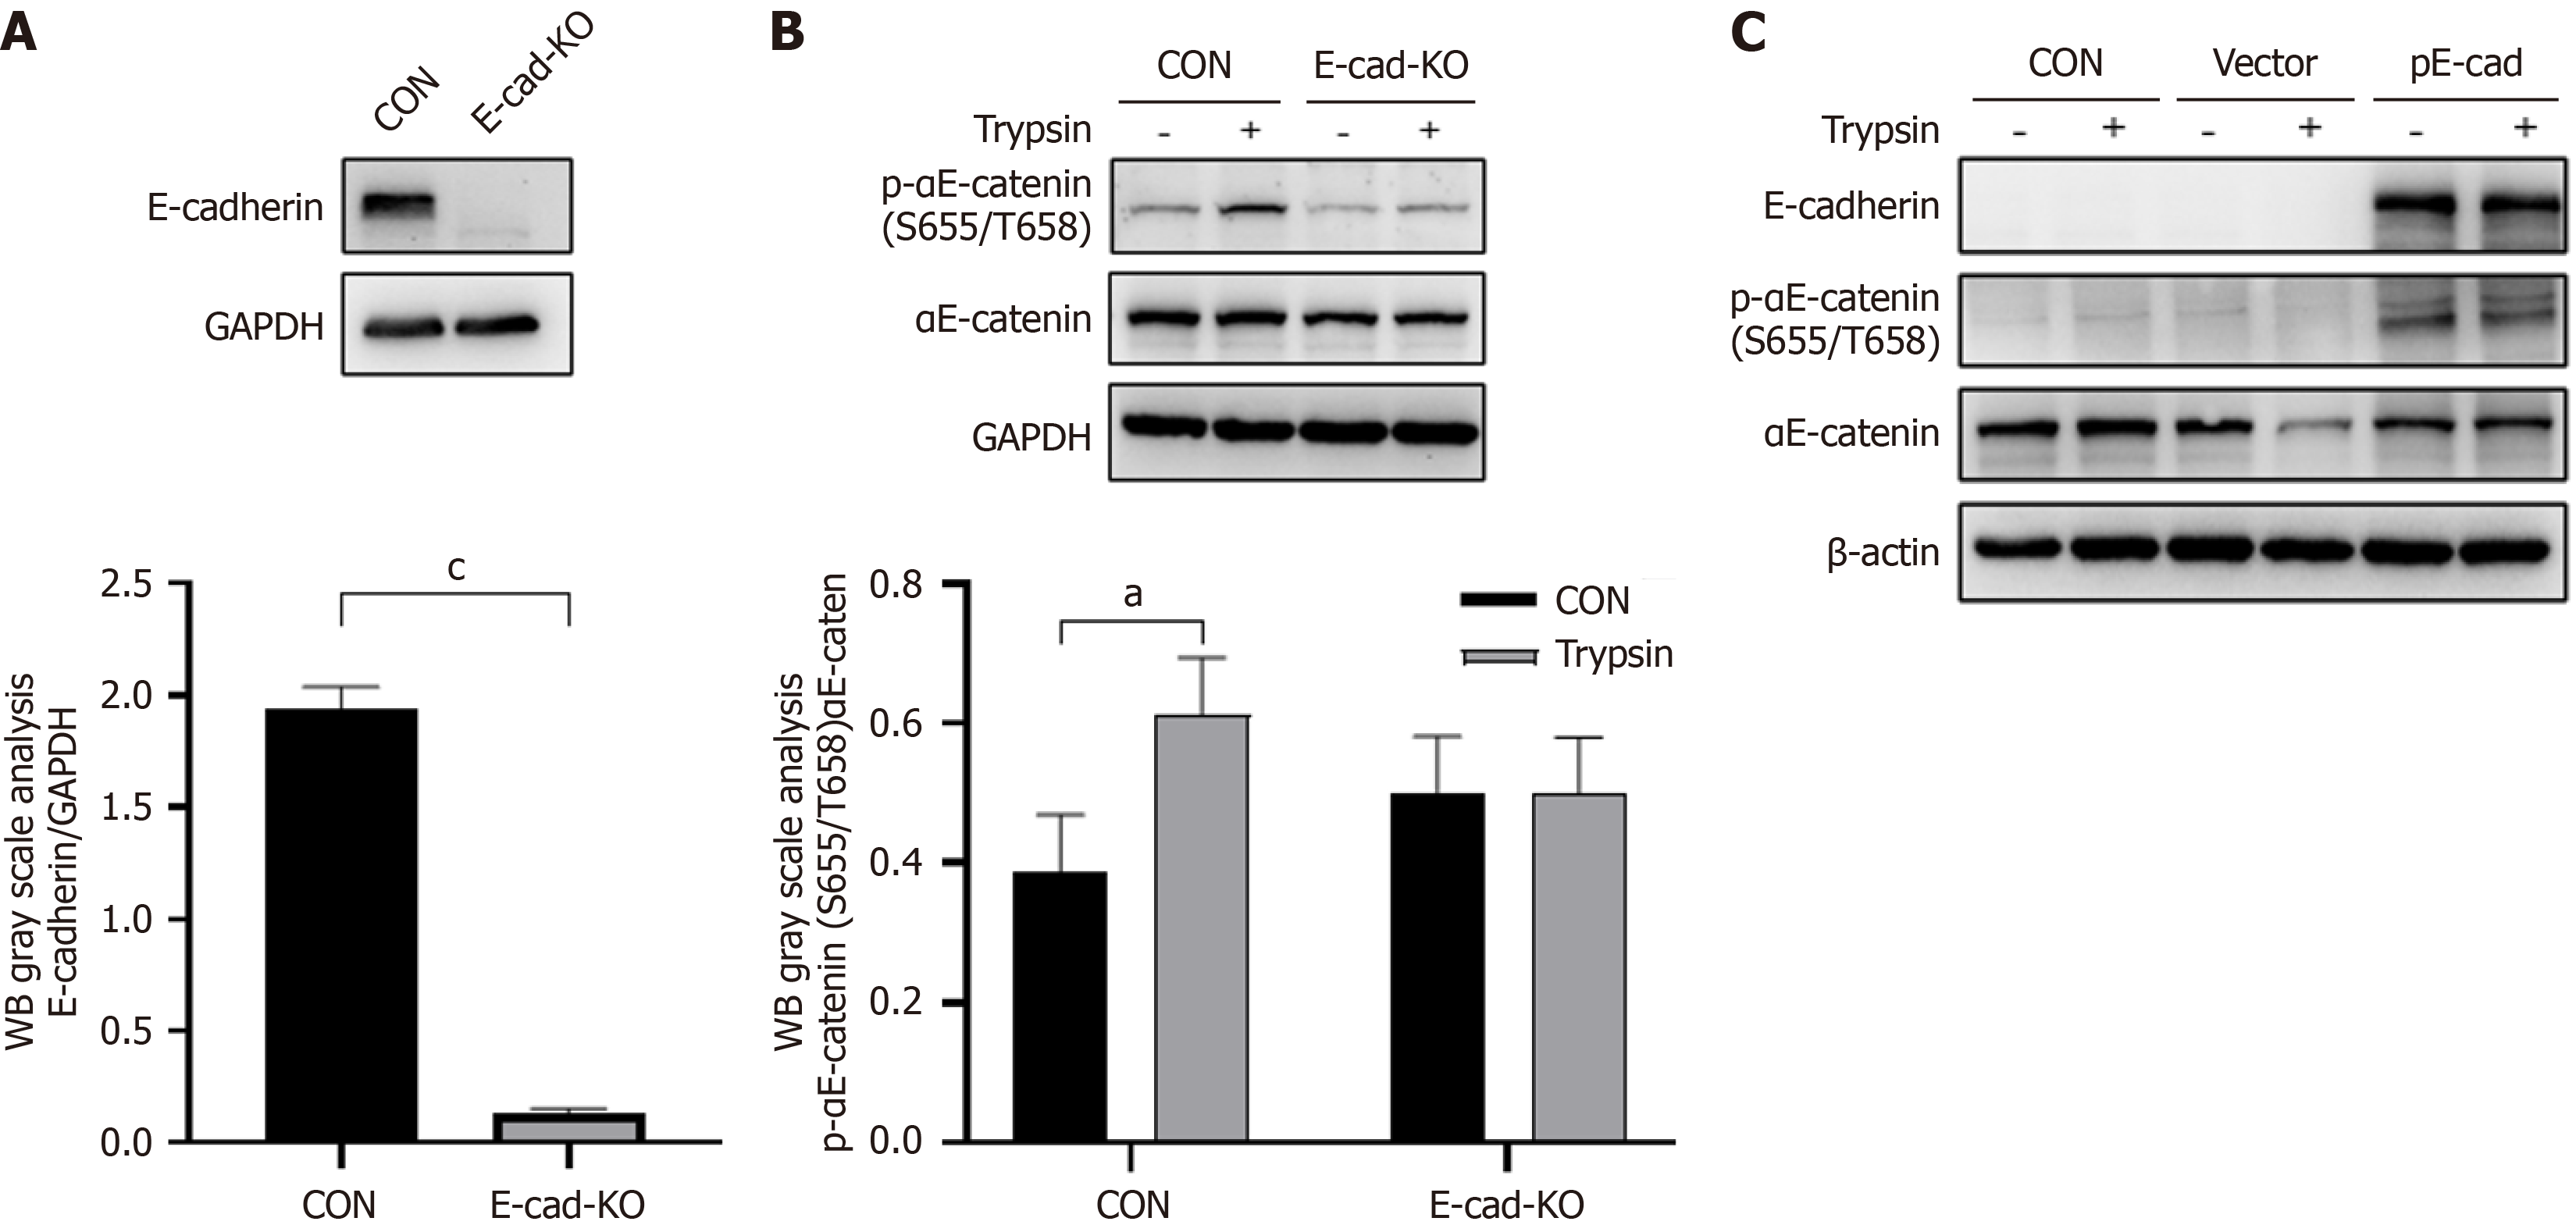
Figure 4 E-cadherin effects on phosphorylation of αE-catenin (Ser655/T658) mediated by trypsin.
A: Representative western blot images reflecting protein expression of E-cadherin of cells with knockout (KO) of E-cadherin gene (CDH1); B: Representative western blot images reflecting protein expression of phospho-αE-catenin (p-αE-catenin) (Ser655/Thr658) in CDH1 KO cells and difference in trypsin-mediated αE-catenin (Ser655/Thr658) phosphorylation before and after KO; C: Representative western blot images reflecting protein expression of p-αE-catenin (Ser655/Thr658) of restoration of E-cadherin in CDH1 KO cells and difference in trypsin-mediated αE-catenin (Ser655/Thr658) phosphorylation before and after restoration (n = 2). aP < 0.05. cP < 0.001. P calculated vs control (CON). GAPDH: Glyceraldehyde-3-phosphate dehydrogenase.
- Citation: Gao L, Lai JS, Chen H, Qian LX, Hong WJ, Li LC. Mechanism of trypsin-mediated differentiation of pancreatic progenitor cells into functional islet-like clusters. World J Diabetes 2025; 16(6): 102727
- URL: https://www.wjgnet.com/1948-9358/full/v16/i6/102727.htm
- DOI: https://dx.doi.org/10.4239/wjd.v16.i6.102727


