Copyright
©The Author(s) 2025.
World J Diabetes. May 15, 2025; 16(5): 99473
Published online May 15, 2025. doi: 10.4239/wjd.v16.i5.99473
Published online May 15, 2025. doi: 10.4239/wjd.v16.i5.99473
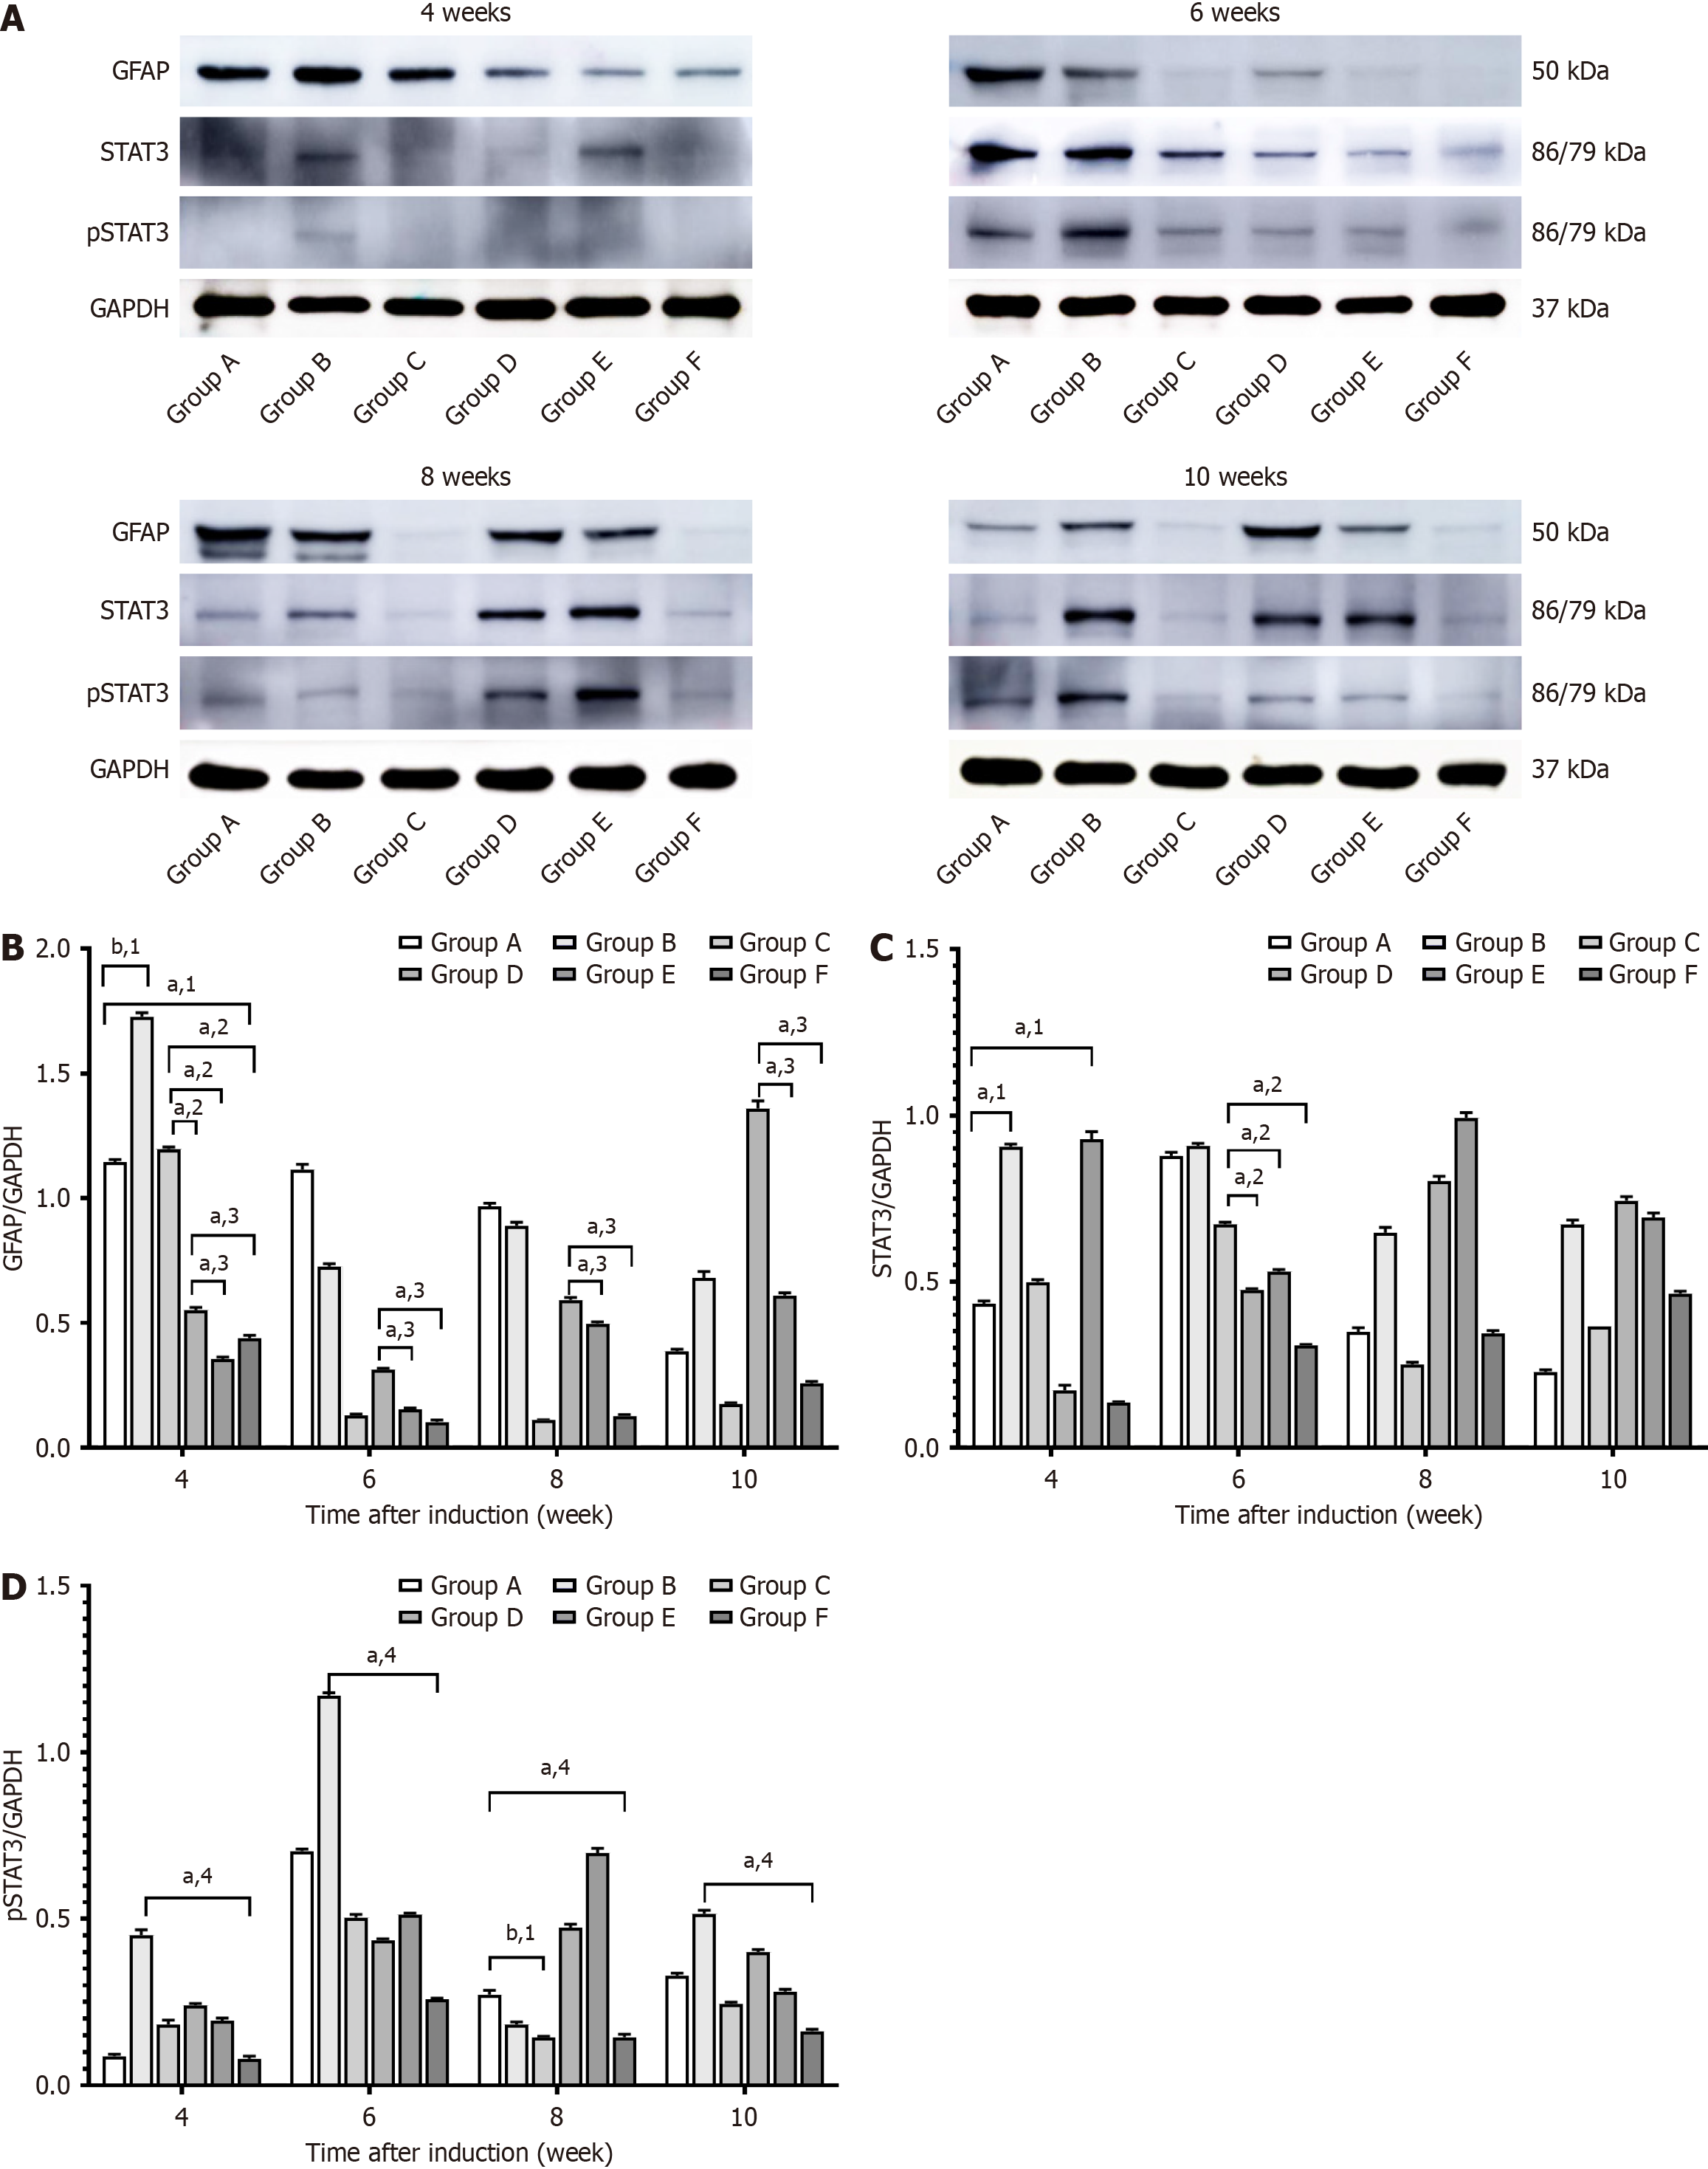
Figure 10 Expression of glial fibrillary acidic protein, signal transducer and activator of transcription 3 (STAT3), and phosphorylated STAT3 proteins in the retinal tissues of each group of Sprague-Dawley rats.
A: Detection of glial fibrillary acidic protein (GFAP), signal transducer and activator of transcription 3 (STAT3), and phosphorylated STAT3 (pSTAT3) protein expression in the retinal tissues of Sprague-Dawley (SD) rats using Western blot analysis; B: Ratio of GFAP protein expression in the retinal tissues of each group of SD rats; C: Ratio of STAT3 protein expression in the retinal tissues of each group of SD rats; D: Ratio of pSTAT3 protein expression in the retinal tissues of each group of rats. All results are expressed as the mean ± SD. aP < 0.05. bP < 0.01. 1P vs A group. 2P vs C group. 3P vs D group. 4P vs F group. GAPDH: Glyceraldehyde-3-phosphate dehydrogenase.
- Citation: Lin YT, Tan J, Tao YL, Hu WW, Wang YC, Huang J, Zhou Q, Xiao A. Effect of ranibizumab on diabetic retinopathy via the vascular endothelial growth factor/STAT3/glial fibrillary acidic protein pathway. World J Diabetes 2025; 16(5): 99473
- URL: https://www.wjgnet.com/1948-9358/full/v16/i5/99473.htm
- DOI: https://dx.doi.org/10.4239/wjd.v16.i5.99473


