Copyright
©The Author(s) 2025.
World J Diabetes. May 15, 2025; 16(5): 104482
Published online May 15, 2025. doi: 10.4239/wjd.v16.i5.104482
Published online May 15, 2025. doi: 10.4239/wjd.v16.i5.104482
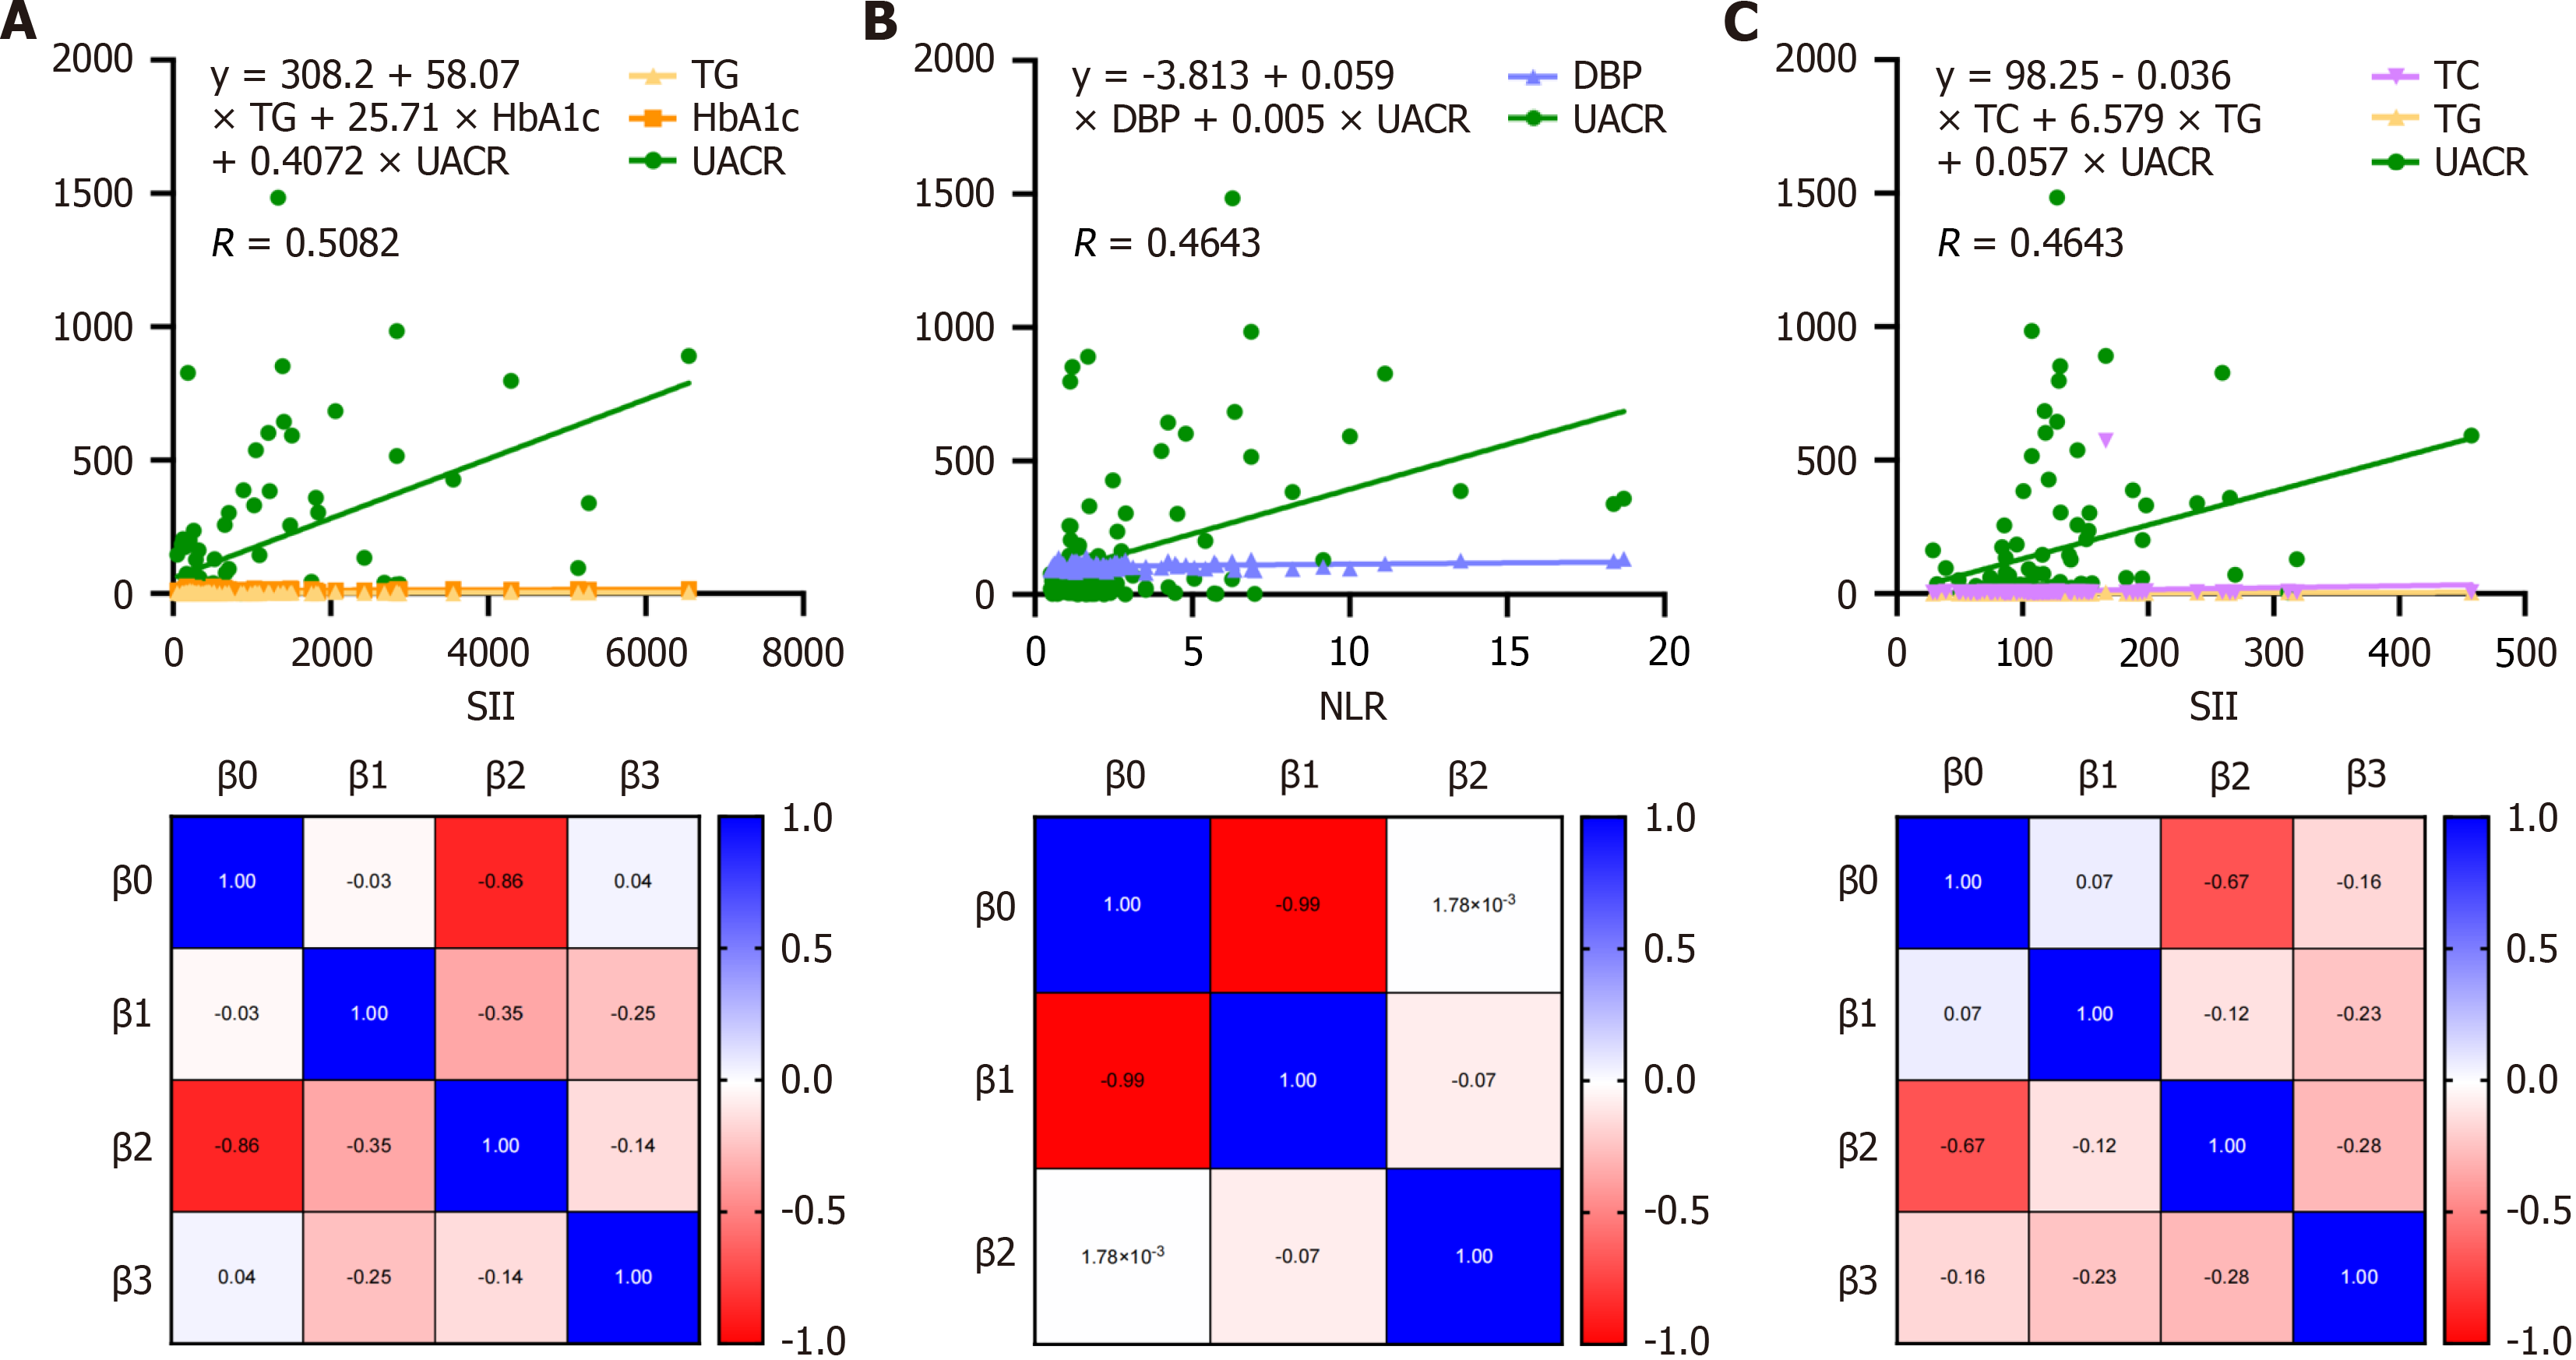
Figure 3 Predictors of systemic inflammatory indices in newly diagnosed type 1 diabetes mellitus children.
A: Linear regression analysis and parameter covariance (heat map) of systemic immune inflammation index levels, showing urinary albumin-to-creatinine ratio (UACR) as the strongest predictor with a significant positive association (estimate = 1.955, P < 0.0001); B: Linear regression analysis and parameter covariance (heat map) of neutrophil-to-lymphocyte ratio levels, highlighting the significant positive contribution of diastolic blood pressure (estimate = 0.056, P = 0.019) and UACR (estimate = 0.005, P < 0.001); C: Linear regression analysis and parameter covariance (heat map) of platelet-to-lymphocyte ratio levels, demonstrating the strong baseline relationship with platelet-to-lymphocyte ratio and significant associations with triglycerides and UACR. SII: Systemic immune inflammation index; TG: Triglycerides; HbA1c: Glycated hemoglobin; DBP: Diastolic blood pressure; UACR: Urinary albumin-to-creatinine ratio; TC: Total cholesterol; NLR: Neutrophil-to-lymphocyte ratio; PLR: Platelet-to-lymphocyte ratio.
- Citation: Cao LF, Xu QB, Yang L. Systemic immune indicators for predicting renal damage in newly diagnosed type 1 diabetic children. World J Diabetes 2025; 16(5): 104482
- URL: https://www.wjgnet.com/1948-9358/full/v16/i5/104482.htm
- DOI: https://dx.doi.org/10.4239/wjd.v16.i5.104482


