











BPG is committed to discovery and dissemination of knowledge
Basic Study
©The Author(s) 2025.
World J Diabetes. Dec 15, 2025; 16(12): 112423
Published online Dec 15, 2025. doi: 10.4239/wjd.v16.i12.112423
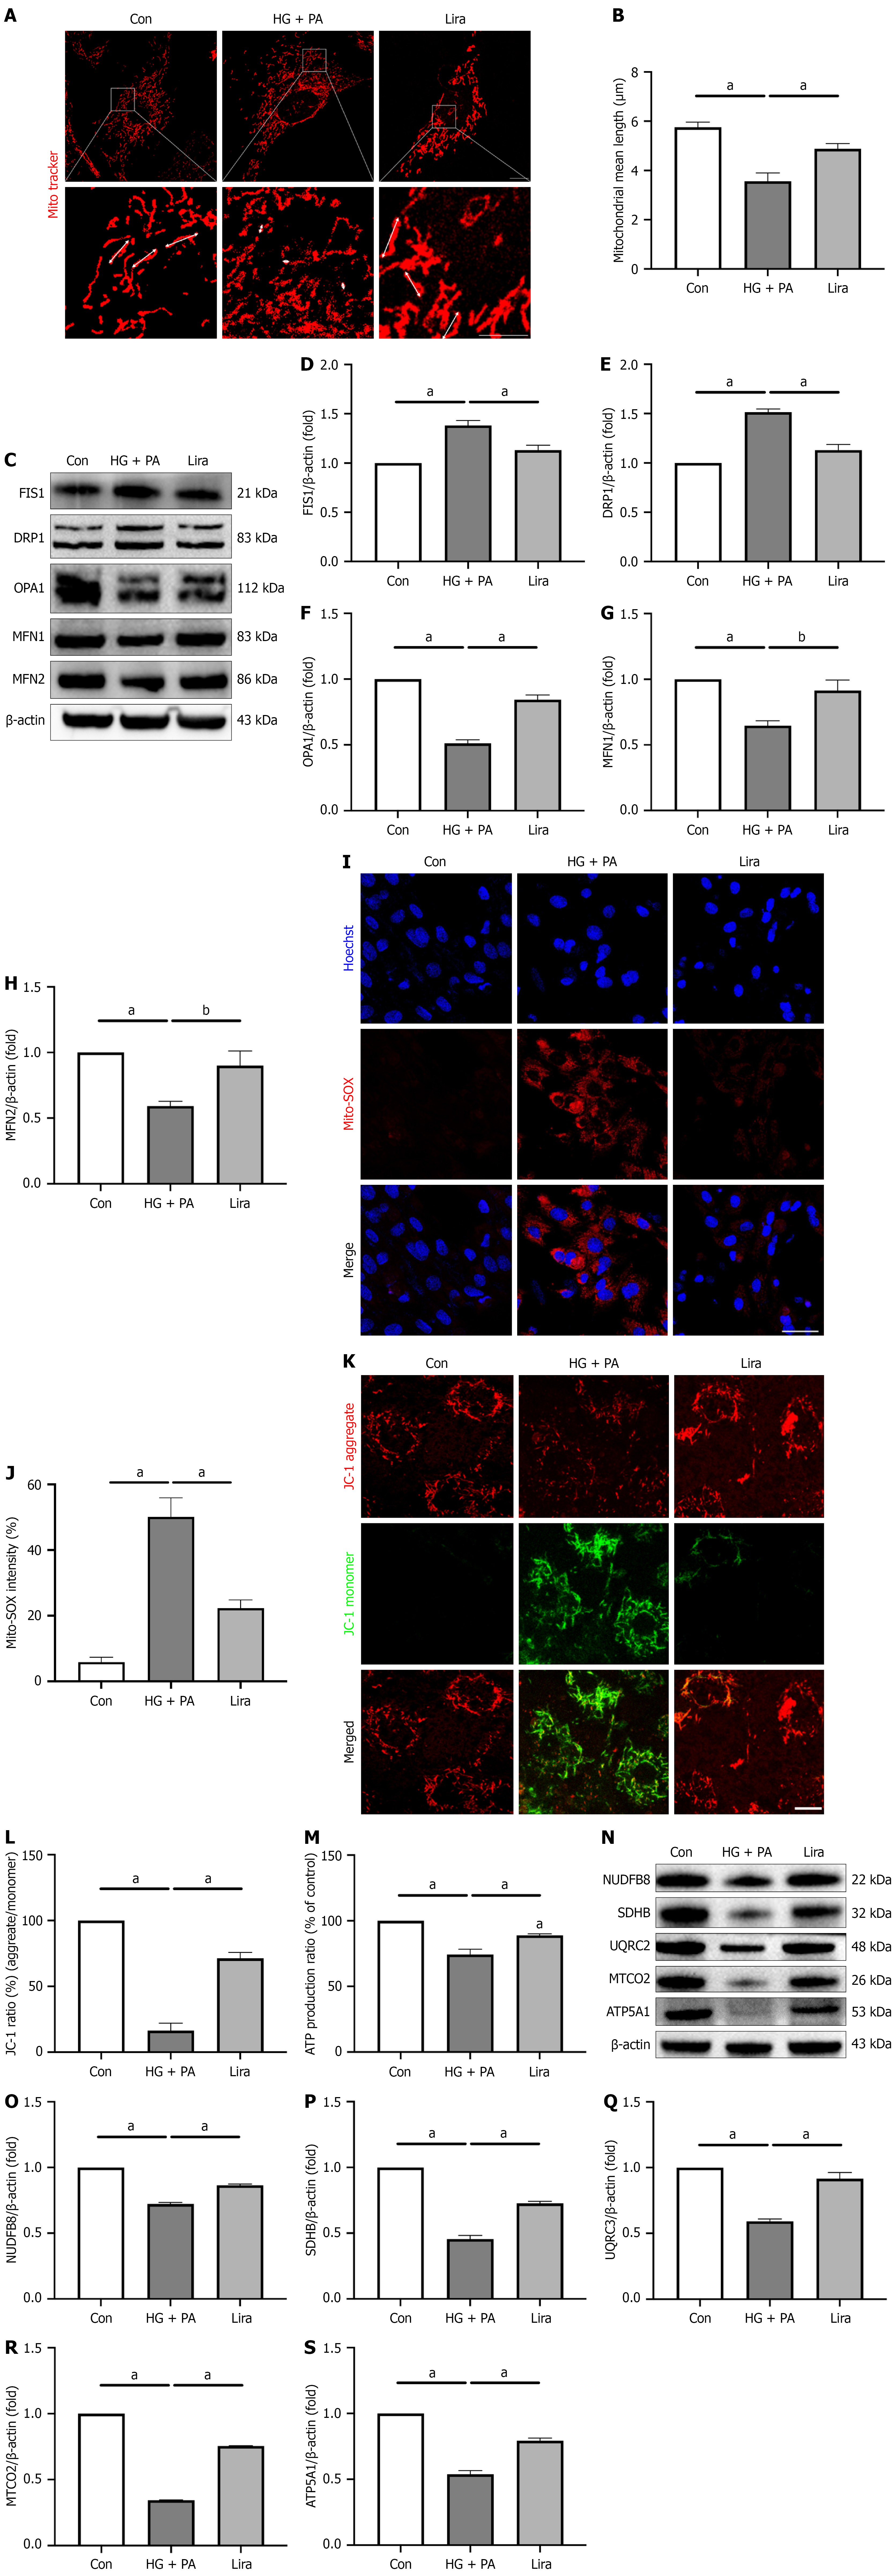
Figure 4
Figure 4 Liraglutide rescues mitochondrial damage in neonatal rat cardiomyocytes induced by high glucose + palmitic acid. A: Representative images Mito Tracker Red of the three groups (scale bar = 25 μm as indicated in upper panel, scale bar = 5 μm as indicated in low panel); B: Quantification of the mitochondrial mean length (white double arrow); C: Representative western blotting images of mitochondrial fission and fusion related proteins including Fis1, DRP1, OPA1, MFN1 and MFN2 in the three groups; D-H: Quantification of the expression of the proteins including Fis1, DRP1, OPA1, MFN1 and MFN2 in B; I: Mito-SOX Red staining representing mitochondrial reactive oxygen species (mitoROS) levels in the three groups (scale bar: 25 μm); J: Quantification of mitoROS production as measured with mito-SOX Red staining in I; K: Representative fluorescence staining images of JC-1 aggregates (red) and JC-1 monomer (green, bar = 25 μm); L: Relative fluorescence intensity of aggregate/monomeric JC-1 in K; M: Quantification of ATP production level in the three groups; N: Representative western blotting images of mitochondrial respiratory chain proteins including NUDFB8, SDHB, UQRC2, MTCO2, ATPA1; O-S: Quantification of the expression of mitochondrial respiratory chain related proteins including NUDFB8, SDHB, UQRC2, MTCO2, ATPA1 in L. Values are presented as the mean ± SD. aP < 0.001; bP < 0.01. Con: Control group; HG: High glucose; PA: Palmitic acid.


Write to the Help Desk