
















©The Author(s) 2025.
World J Diabetes. Dec 15, 2025; 16(12): 111963
Published online Dec 15, 2025. doi: 10.4239/wjd.v16.i12.111963
Published online Dec 15, 2025. doi: 10.4239/wjd.v16.i12.111963
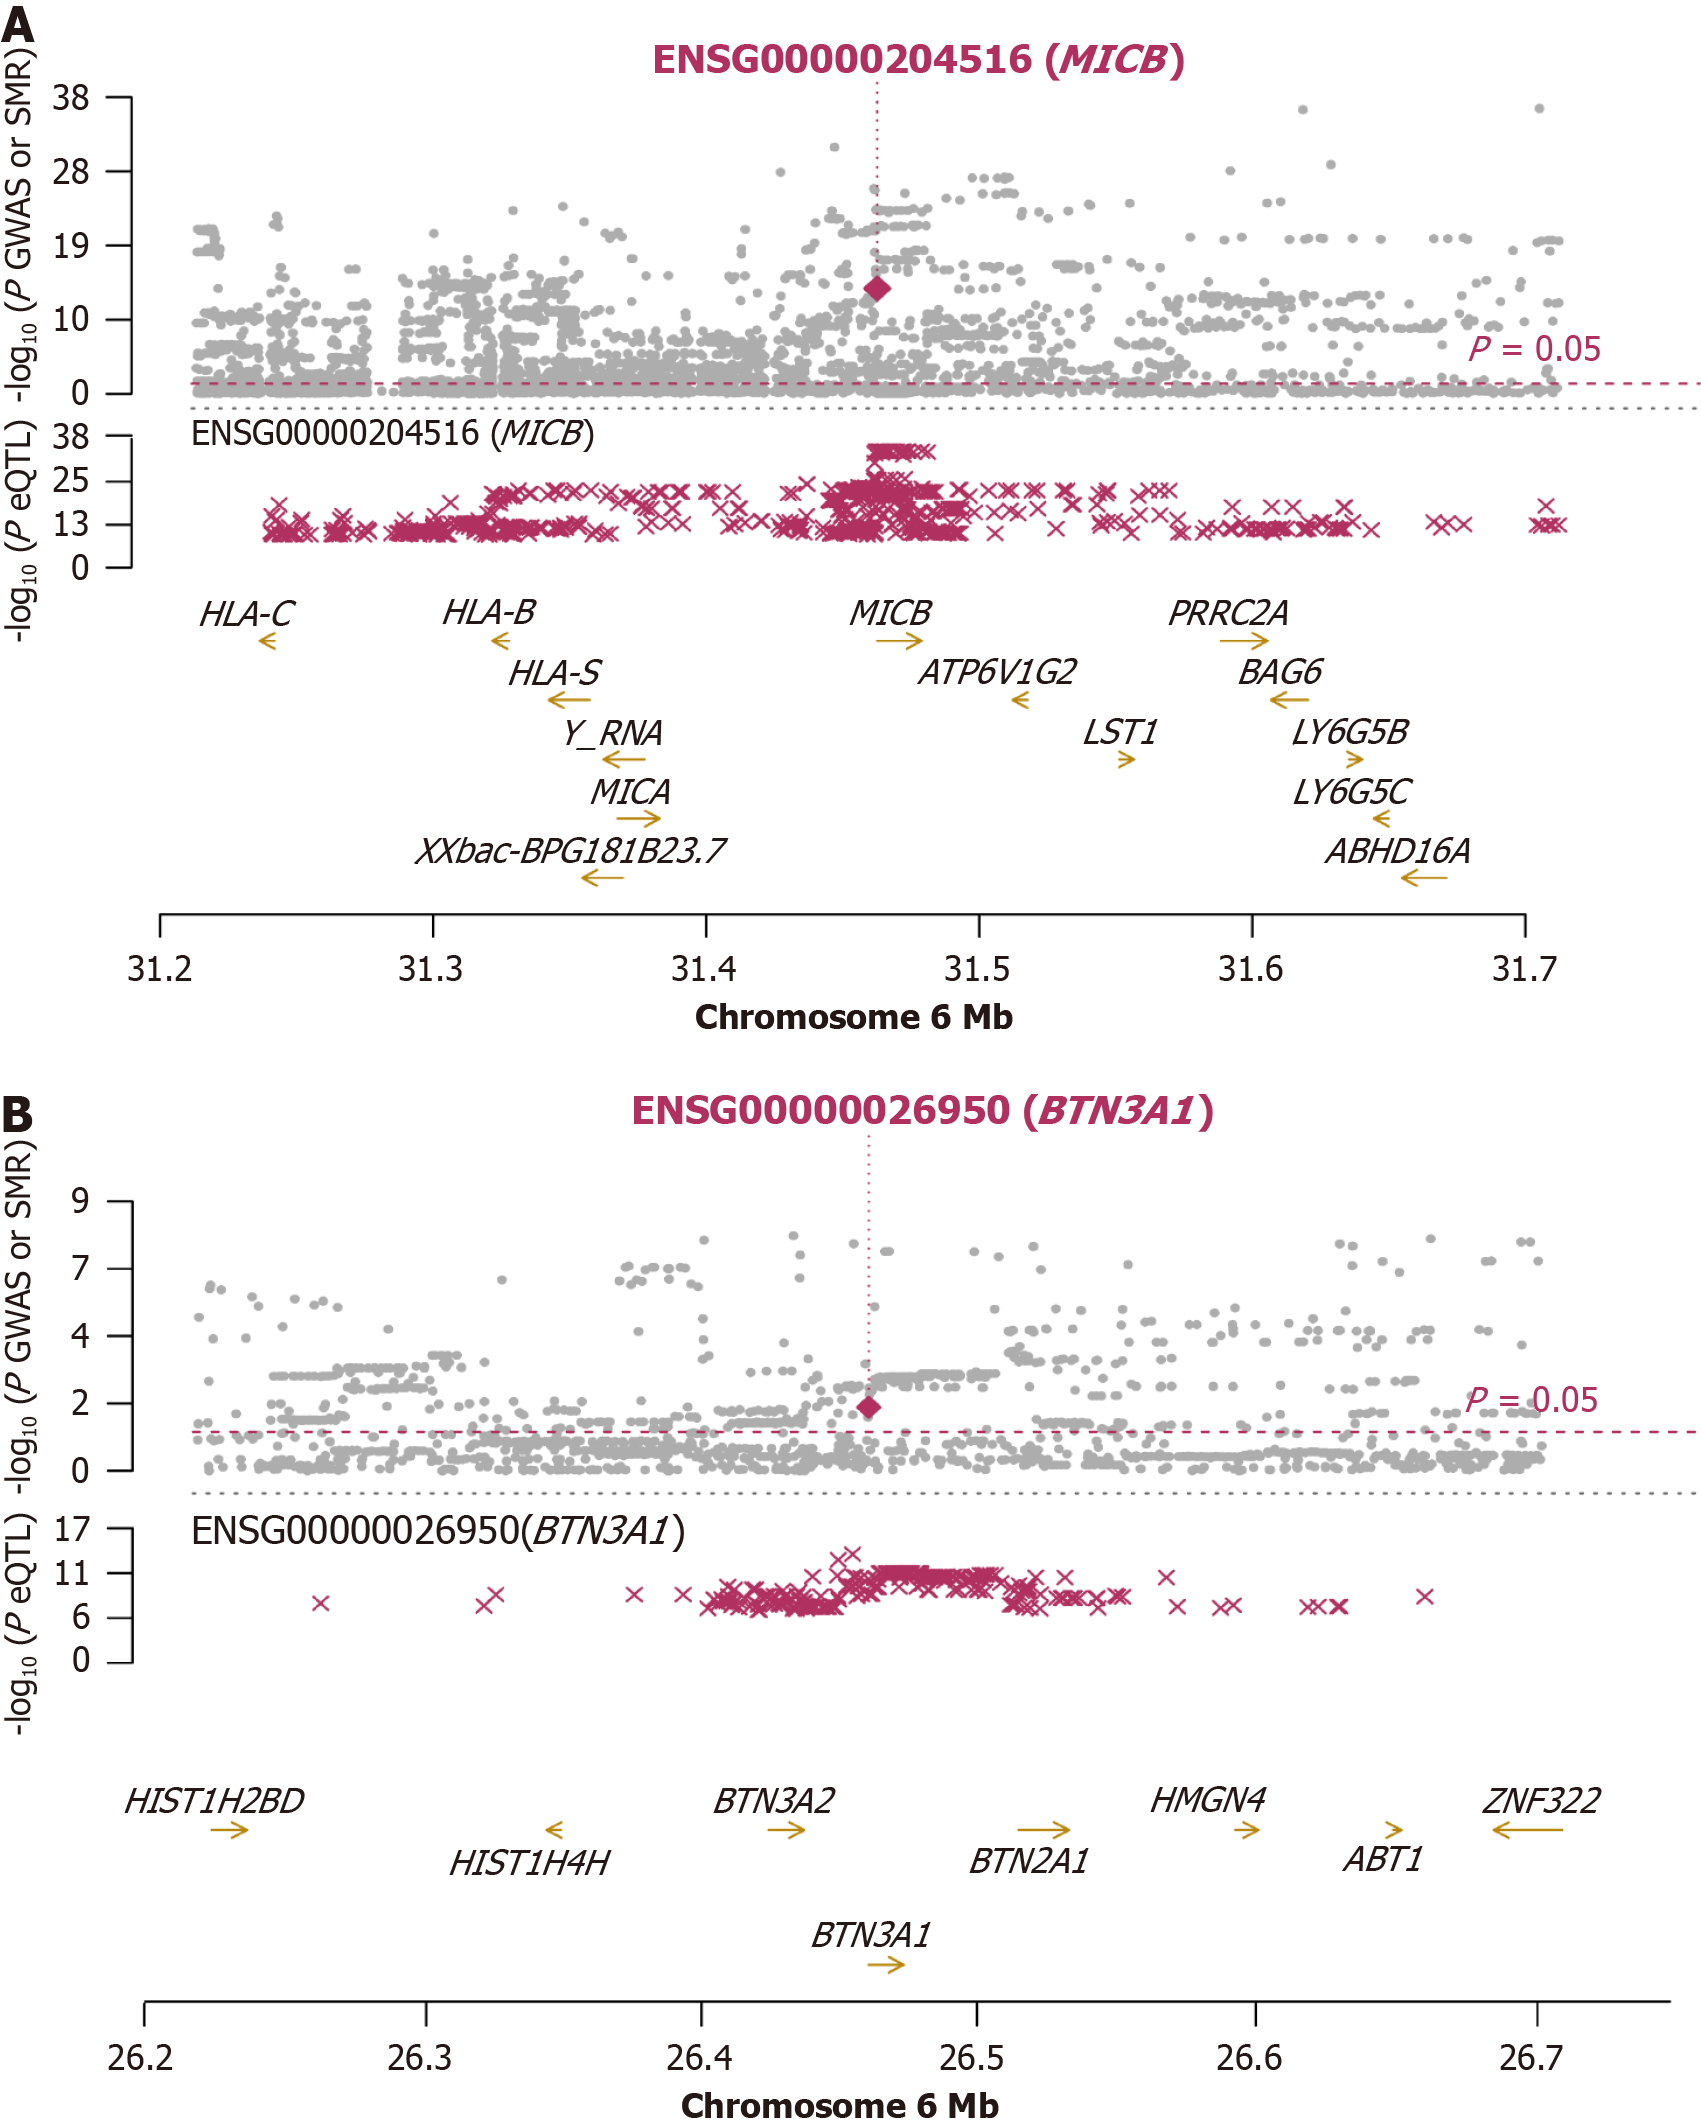
Figure 4 Summary data-based Mendelian randomization plot of the MICB and BTN3A1 locus.
The top panel depicts diabetic neuropathy genome-wide association studies P values (grey dots), the middle panel depicts expression quantitative trait loci P values, and the bottom panel depicts gene locations on chromosome 6. The red diamonds in the upper panel indicate the summary data-based Mendelian randomization test P values for positive genes, and the dashed lines indicate the significance thresholds. A: A locus plot of MICB; B: A locus plot of BTN3A1. eQTL: Expression quantitative trait loci; GWAS: Genome-wide association studies; SMR: Summary-data-based Mendelian randomization.
- Citation: Ding XF, Dang X, Lin S. Identification of novel therapeutic targets for diabetic neuropathy through integrated proteomics and transcriptomics approaches. World J Diabetes 2025; 16(12): 111963
- URL: https://www.wjgnet.com/1948-9358/full/v16/i12/111963.htm
- DOI: https://dx.doi.org/10.4239/wjd.v16.i12.111963