
















©The Author(s) 2025.
World J Diabetes. Dec 15, 2025; 16(12): 111771
Published online Dec 15, 2025. doi: 10.4239/wjd.v16.i12.111771
Published online Dec 15, 2025. doi: 10.4239/wjd.v16.i12.111771
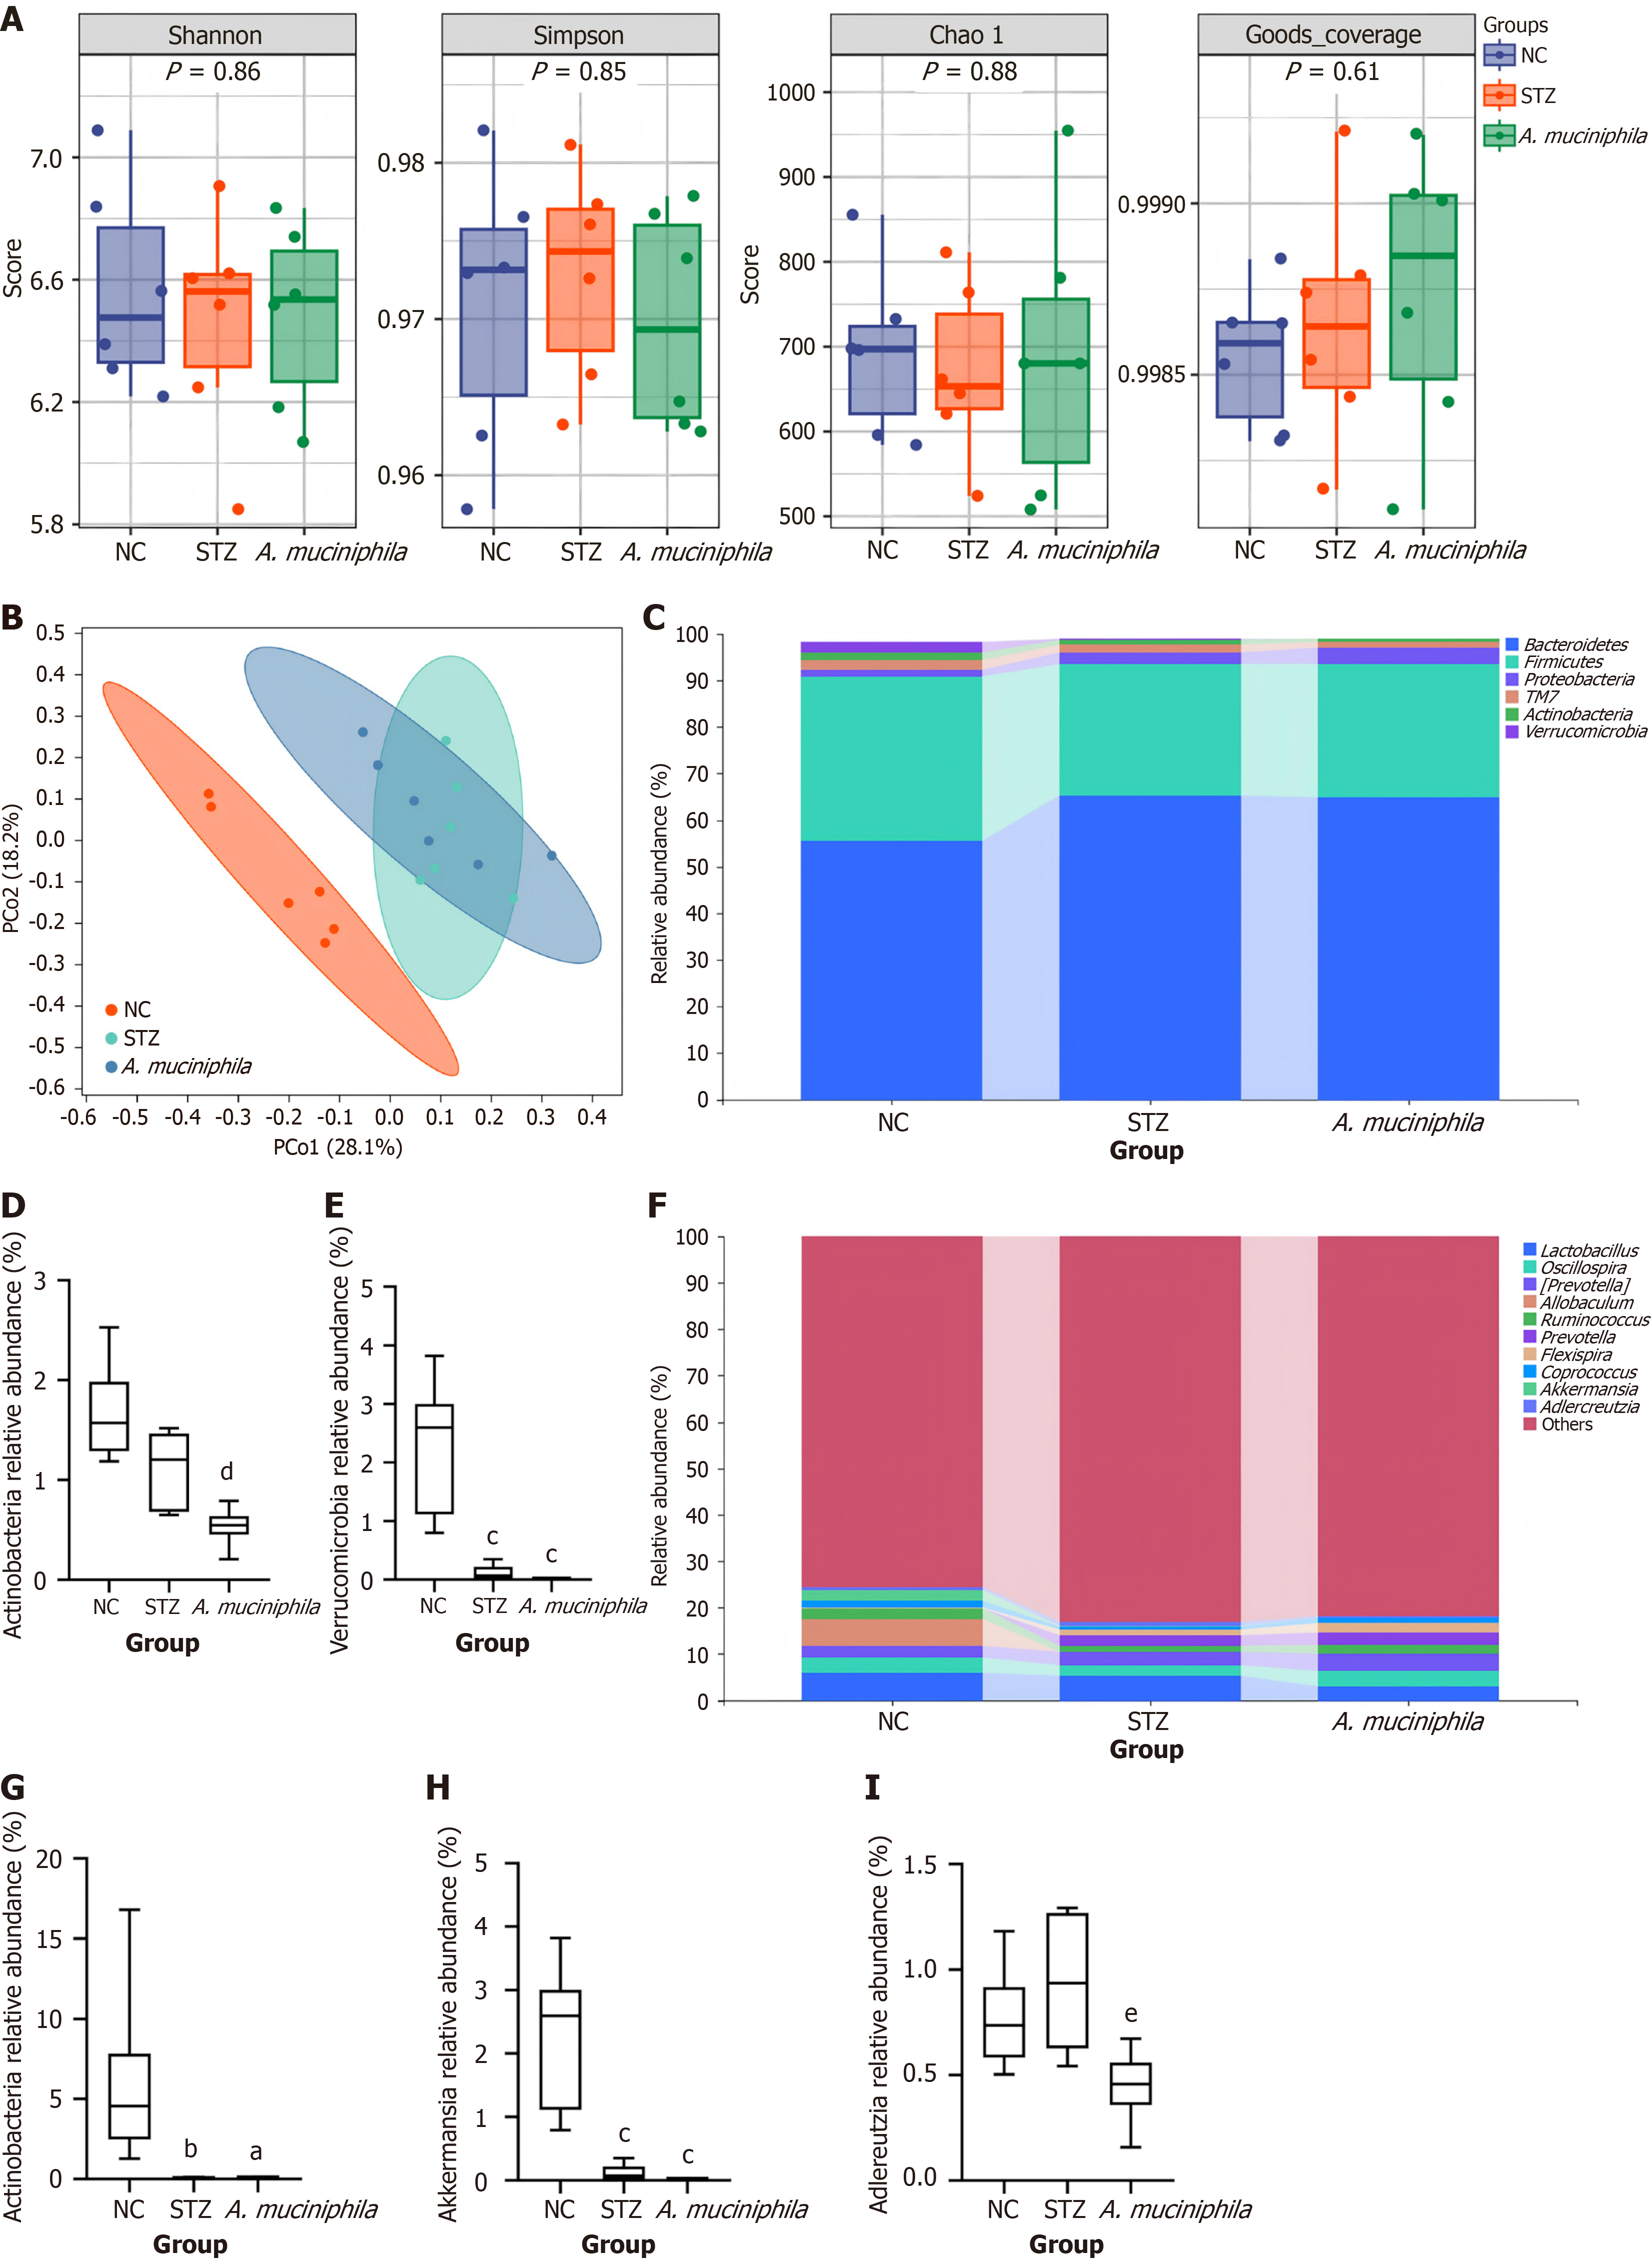
Figure 4 Alpha diversity analysis, principal component analysis and phylum-level abundance changes in the intestinal flora of the mice in each group during different periods.
A: Box plot of the alpha diversity analysis of the mice in each group; B: Principal component analysis of species differences at the baseline level among the different groups of mice; C: Relative abundance of phylum-level flora in each group of mice; D: Column diagram of the relative abundance of Actinobacteria in the mice in each group (n = 6); E: Verrucomicrobia relative abundance histogram for the mice in each group (n = 6); F: Relative abundance of genus-level flora in the mice in each group; G: Histogram of the relative abundance of Allobaculum in the mice in each group (n = 6); H: Histogram of the relative abundance of Akkermansia in the mice in each group (n = 6); I: Histogram of the relative abundance of Adlercreutzia in the mice in each group (n = 6). aP < 0.05 vs negative control group. bP < 0.01 vs negative control group. cP < 0.001 vs negative control group. dP < 0.05 vs streptozotocin-induced type 1 diabetes mellitus group. eP < 0.01 vs streptozotocin-induced type 1 diabetes mellitus group. PCo1: First principal component; PCo2: Second principal component; NC group: Negative control group; STZ group: Streptozotocin-induced type 1 diabetes mellitus group; A. muciniphila group: Akkermansia muciniphila intervention group.
- Citation: Huang BJ, Guo S, Lin XY, Li YH, Ma HM, Zhang J, Chen QL. Oral Akkermansia muciniphila may ameliorates immune dysregulation in a murine model of streptozotocin-induced type 1 diabetes. World J Diabetes 2025; 16(12): 111771
- URL: https://www.wjgnet.com/1948-9358/full/v16/i12/111771.htm
- DOI: https://dx.doi.org/10.4239/wjd.v16.i12.111771