
















©The Author(s) 2025.
World J Diabetes. Dec 15, 2025; 16(12): 111771
Published online Dec 15, 2025. doi: 10.4239/wjd.v16.i12.111771
Published online Dec 15, 2025. doi: 10.4239/wjd.v16.i12.111771
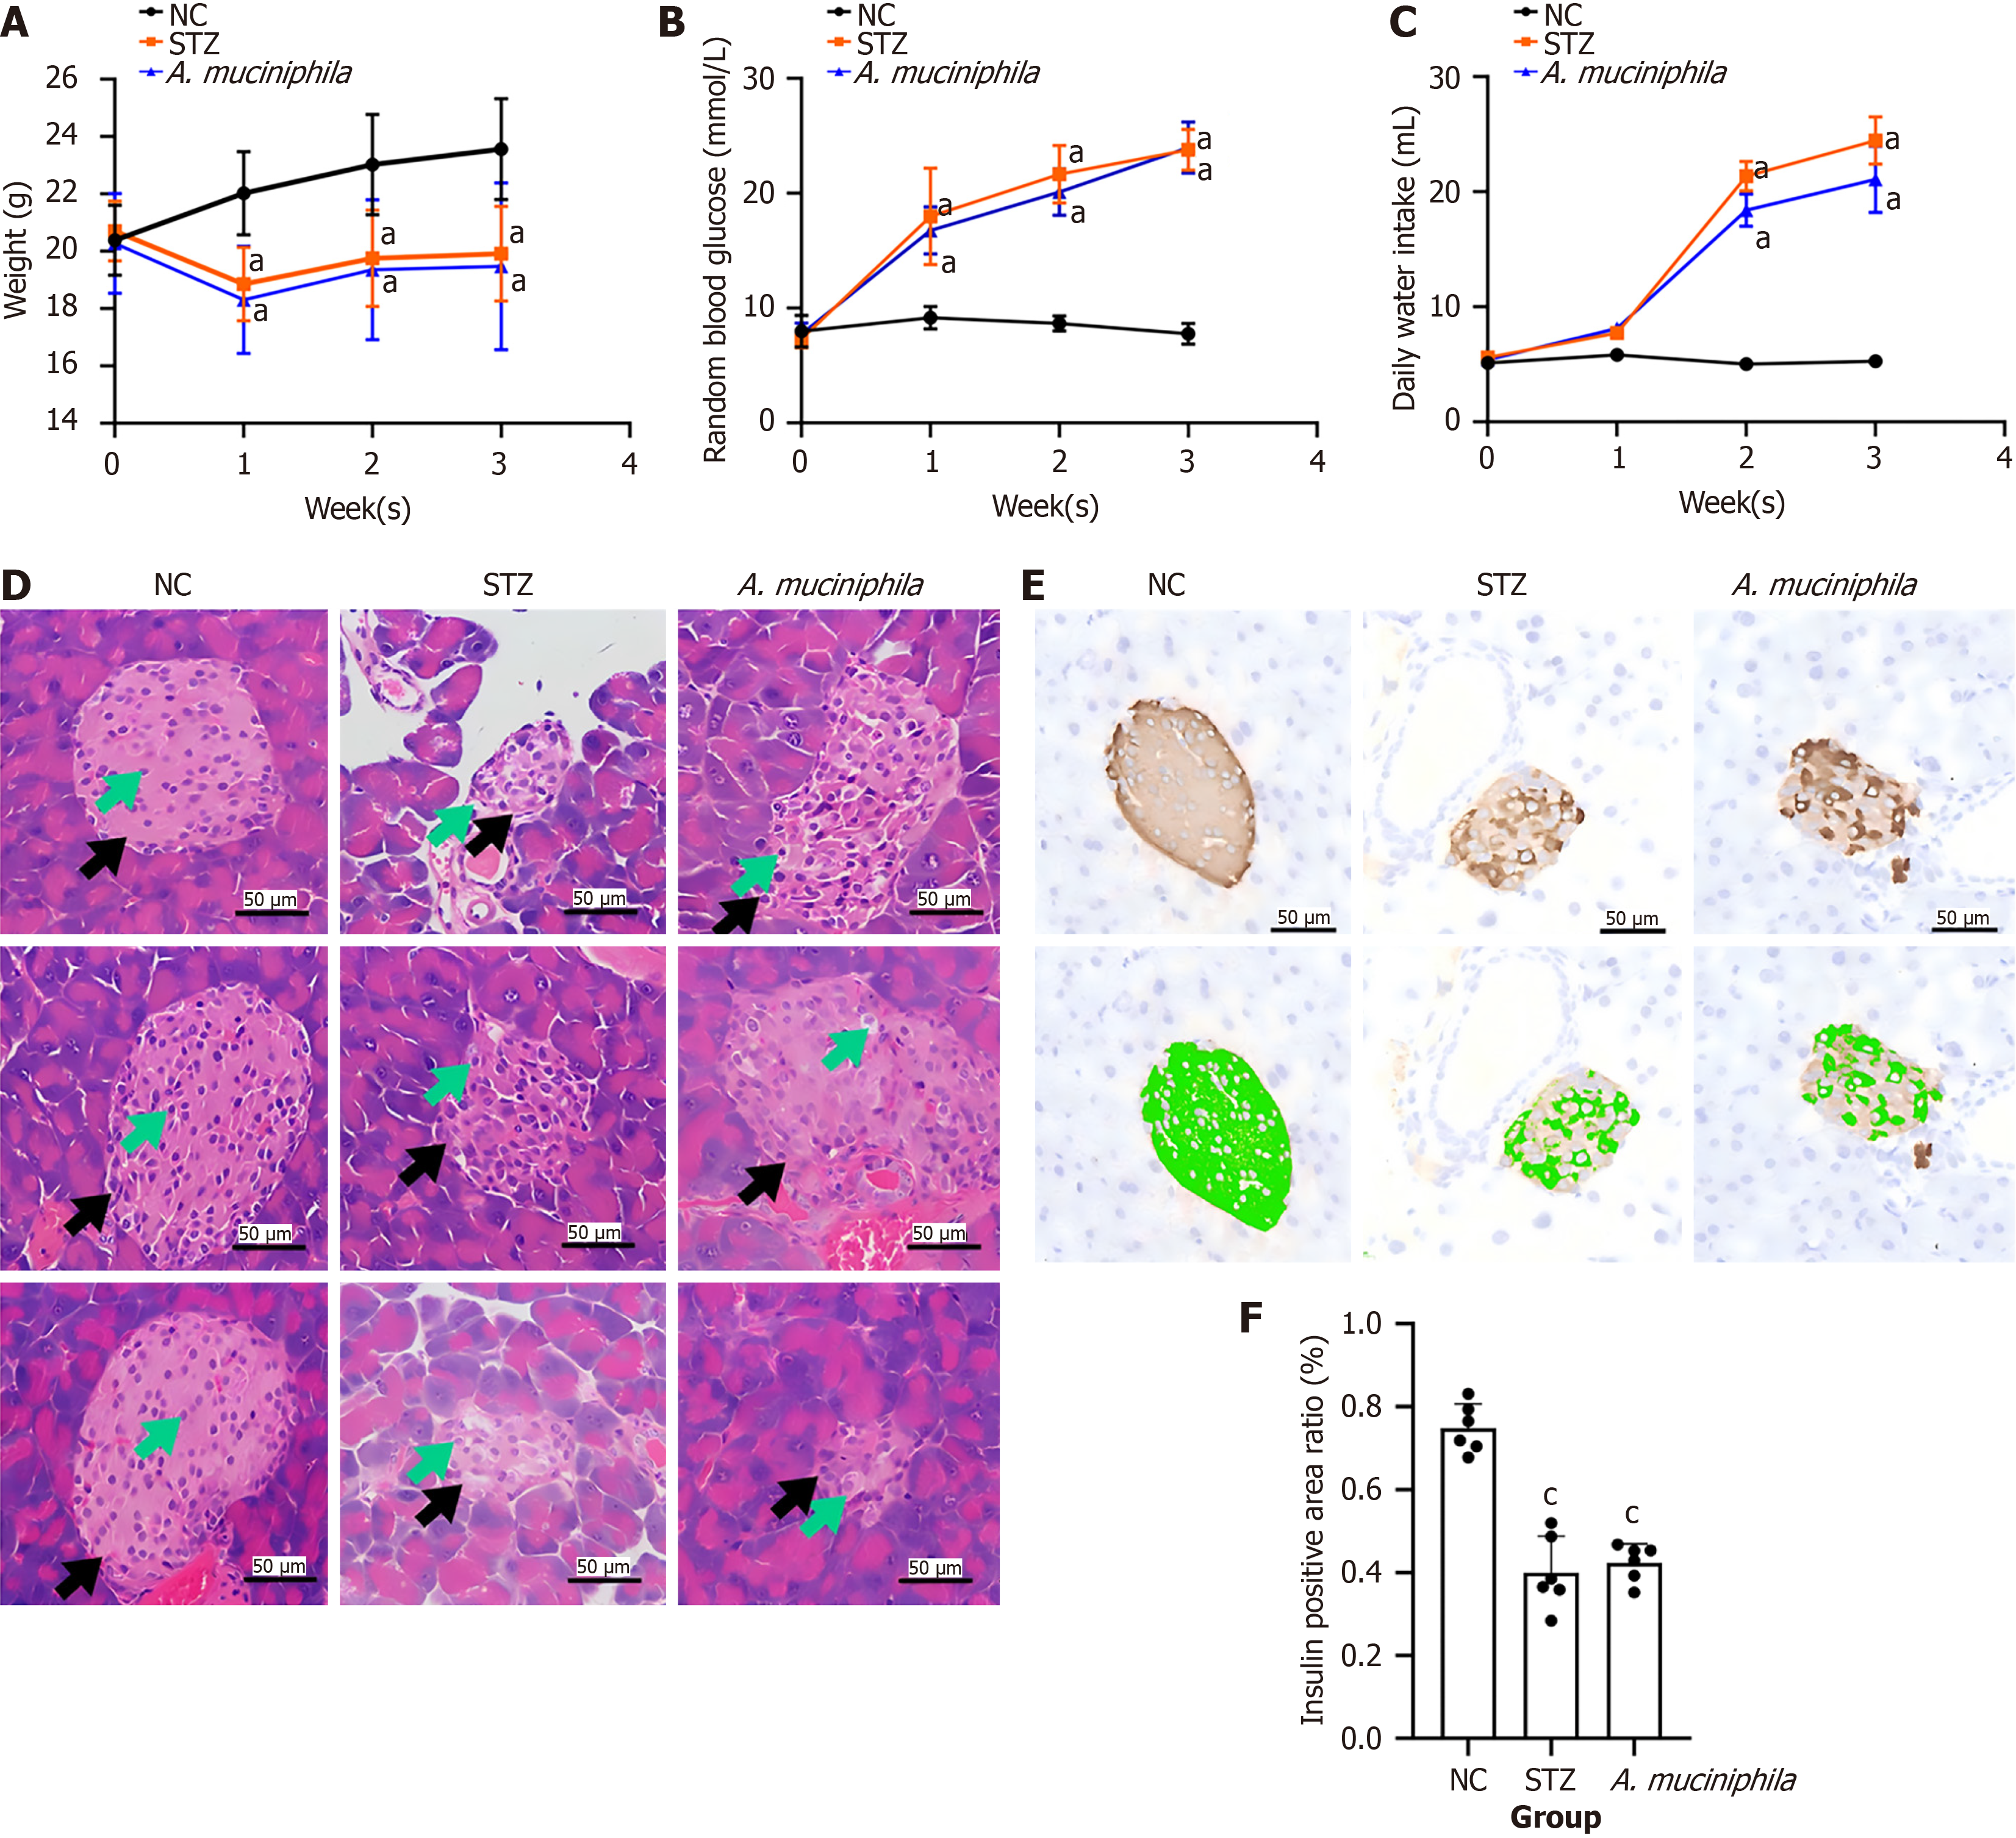
Figure 1 Physiological and pathological changes in the mice in each group (400 times).
A: Body weight line chart of the mice in each group (n = 10); B: Random blood glucose line chart for each group of mice (n = 10); C: Break-line diagram of the daily water intake of the mice in each group (n = 3); D: Hematoxylin-eosin staining changes in islet pathology in each group (400 times, n = 4); E: Changes in insulin immunohistochemical staining in each group (400 times, n = 6); F: Statistical analysis of the insulin-positive area ratio in each group (n = 6). 1-3 are three pairs of pathological hematoxylin-eosin changes from each group. aP < 0.05 vs negative control group. cP < 0.001 vs negative control group. NC group: Negative control group; STZ group: Streptozotocin-induced type 1 diabetes mellitus group; A. muciniphila group: Akkermansia muciniphila intervention group.
- Citation: Huang BJ, Guo S, Lin XY, Li YH, Ma HM, Zhang J, Chen QL. Oral Akkermansia muciniphila may ameliorates immune dysregulation in a murine model of streptozotocin-induced type 1 diabetes. World J Diabetes 2025; 16(12): 111771
- URL: https://www.wjgnet.com/1948-9358/full/v16/i12/111771.htm
- DOI: https://dx.doi.org/10.4239/wjd.v16.i12.111771