
















©The Author(s) 2025.
World J Diabetes. Nov 15, 2025; 16(11): 111223
Published online Nov 15, 2025. doi: 10.4239/wjd.v16.i11.111223
Published online Nov 15, 2025. doi: 10.4239/wjd.v16.i11.111223
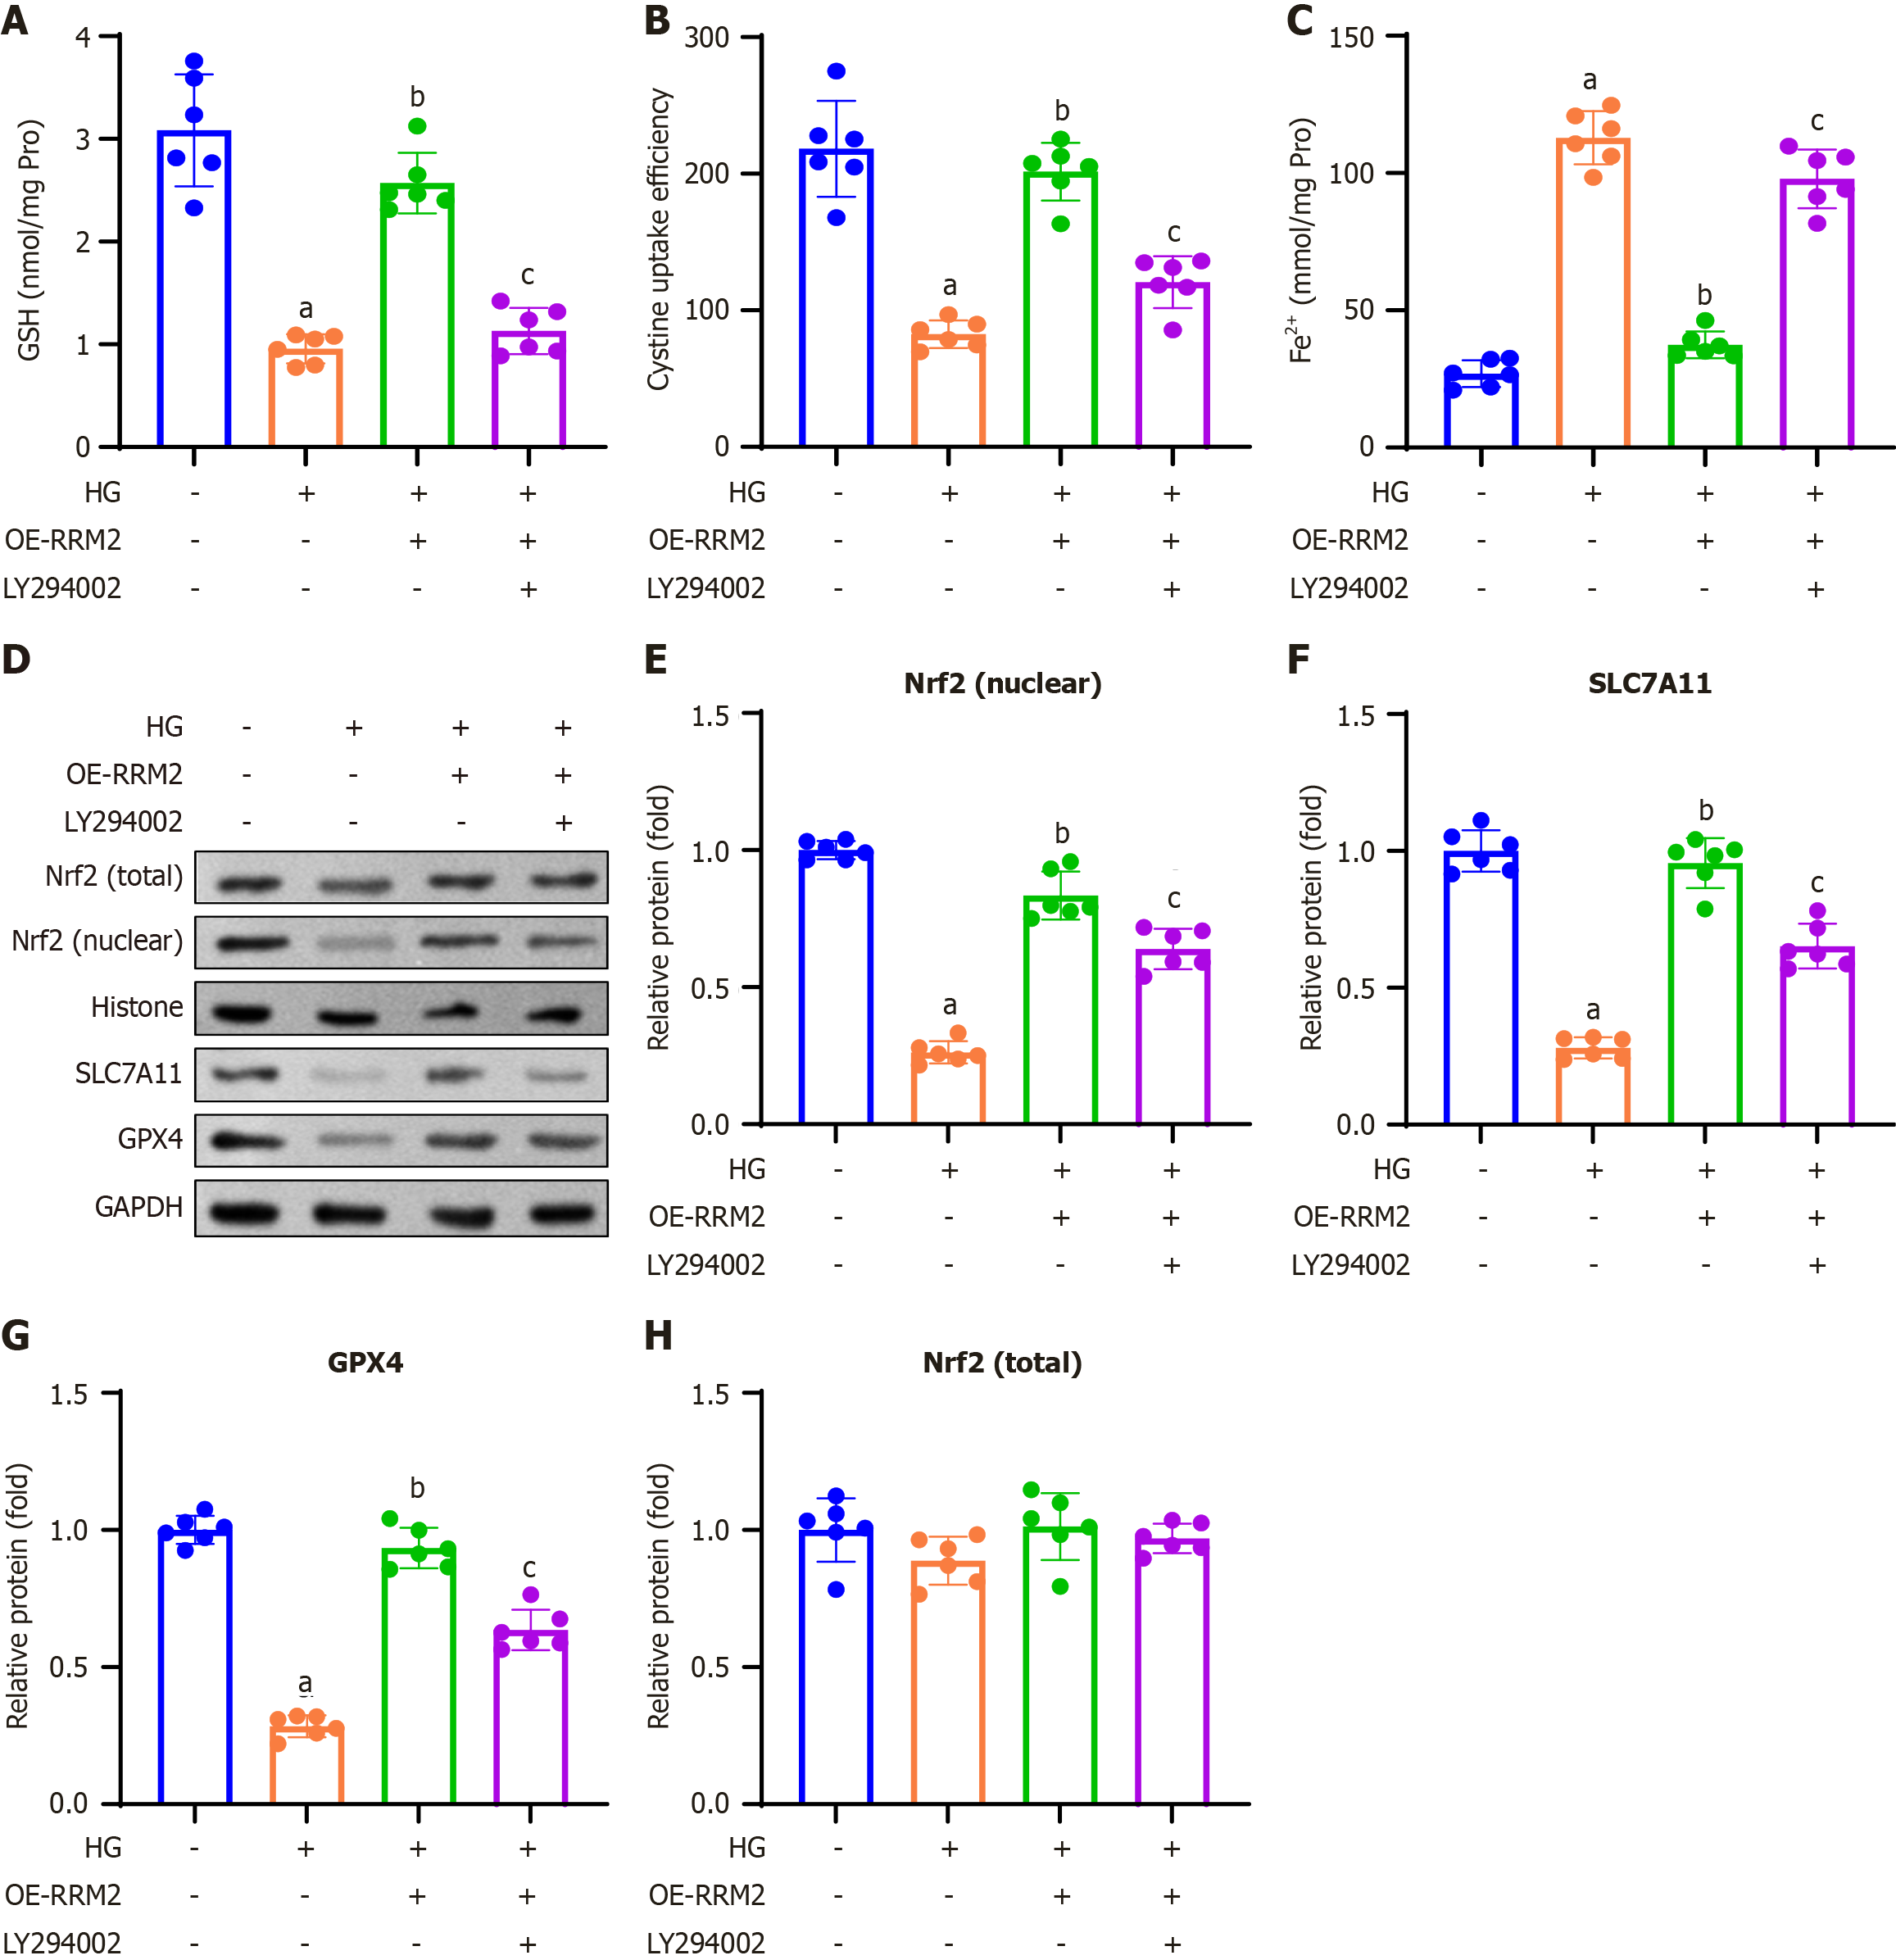
Figure 6 Ribonucleotide reductase regulatory subunit M2 overexpression modulates ferroptosis-related indicators and proteins through the PI3K/Akt pathway.
A: Colorimetric method was used to analyze the glutathione content; B: Cystine uptake capacity was measured in high glucose (HG)-treated HK-2 cells; C: The concentration of Fe2+ was measured in the HG-treated HK-2 cells; D: Western blotting was performed to determine ferroptosis-related proteins; E-H: Nrf2 (E; nuclear, normalized to histone), SLC7A11 (F) GPX4 (G), and quantification of Nrf2 (H; total, normalized to GAPDH). Data are presented as mean ± SD in triplicate and analyzed using one-way ANOVA. aP < 0.001 vs control group; bP < 0.001 vs HG group; cP < 0.001 vs HG + overexpressing-ribonucleotide reductase regulatory subunit M2 group. HG: High glucose; OE-RRM2: Overexpressing ribonucleotide reductase regulatory subunit M2; GSH: Glutathione.
- Citation: Gao CC, Ding FF, Jiang X. RRM2 attenuates the renal tubular ferroptosis in diabetic kidney disease through PI3K/Akt/Nrf2 pathway. World J Diabetes 2025; 16(11): 111223
- URL: https://www.wjgnet.com/1948-9358/full/v16/i11/111223.htm
- DOI: https://dx.doi.org/10.4239/wjd.v16.i11.111223