
















©The Author(s) 2025.
World J Diabetes. Nov 15, 2025; 16(11): 109919
Published online Nov 15, 2025. doi: 10.4239/wjd.v16.i11.109919
Published online Nov 15, 2025. doi: 10.4239/wjd.v16.i11.109919
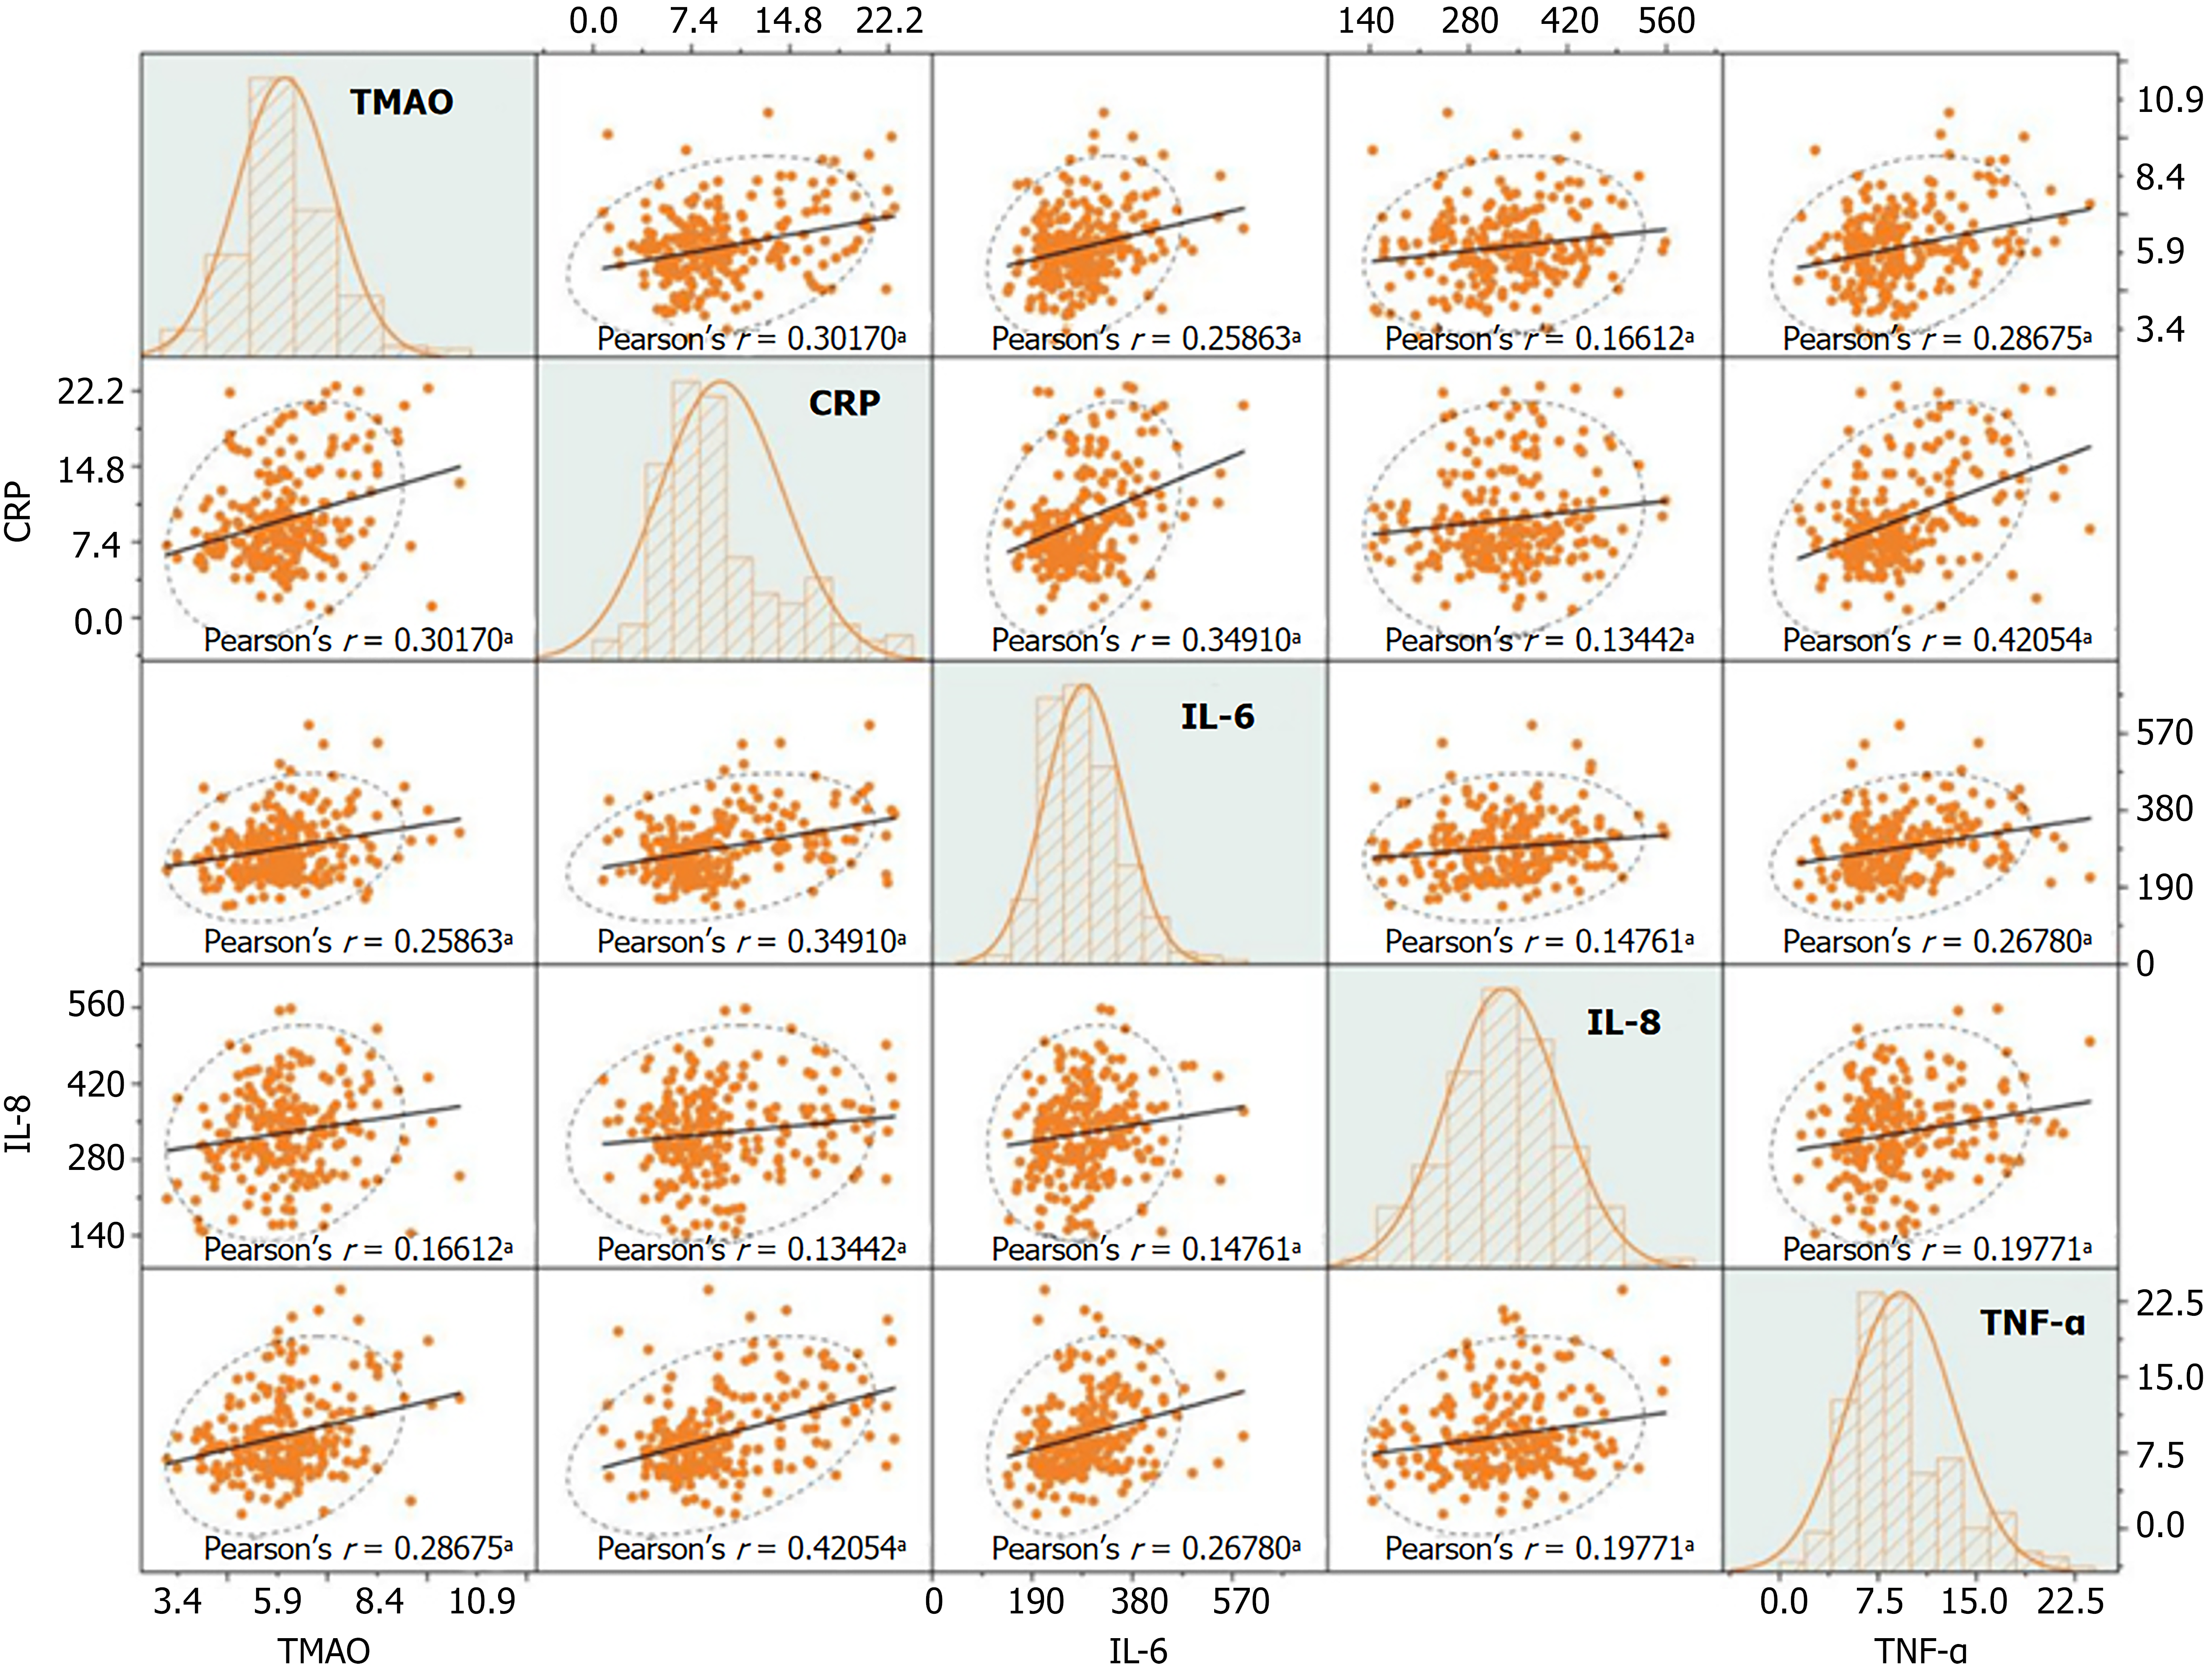
Figure 5 Correlation analysis of trimethylamine N-oxide and inflammatory factor levels in patients with diabetic nephropathy.
Matrix scatter plot. r denotes the correlation coefficient. Polynomial fitting is used to explore potential nonlinear trends, and the Pearson correlation coefficient r is applied to quantify the strength of relationships between variables. Histograms on the diagonal represent data distribution patterns. In the scatter plots, an upward-sloping trend line indicates a positive correlation, while a downward-sloping trend line indicates a negative correlation. Data points clustered within the ellipse represent the main distribution area, whereas points outside the ellipse are considered outliers. aP < 0.05. TMAO: Trimethylamine N-oxide; CRP: C-reactive protein; IL-6: Interleukin-6; IL-8: Interleukin-8; TNF-α: Tumor necrosis factor.
- Citation: Pan ZL, Li MQ, Zhang J, Xue LY, Shi YP. Correlation of gut microbiota metabolite trimethylamine N-oxide with inflammatory levels and osteoporosis in patients with diabetic nephropathy. World J Diabetes 2025; 16(11): 109919
- URL: https://www.wjgnet.com/1948-9358/full/v16/i11/109919.htm
- DOI: https://dx.doi.org/10.4239/wjd.v16.i11.109919