
















©The Author(s) 2025.
World J Diabetes. Nov 15, 2025; 16(11): 109919
Published online Nov 15, 2025. doi: 10.4239/wjd.v16.i11.109919
Published online Nov 15, 2025. doi: 10.4239/wjd.v16.i11.109919
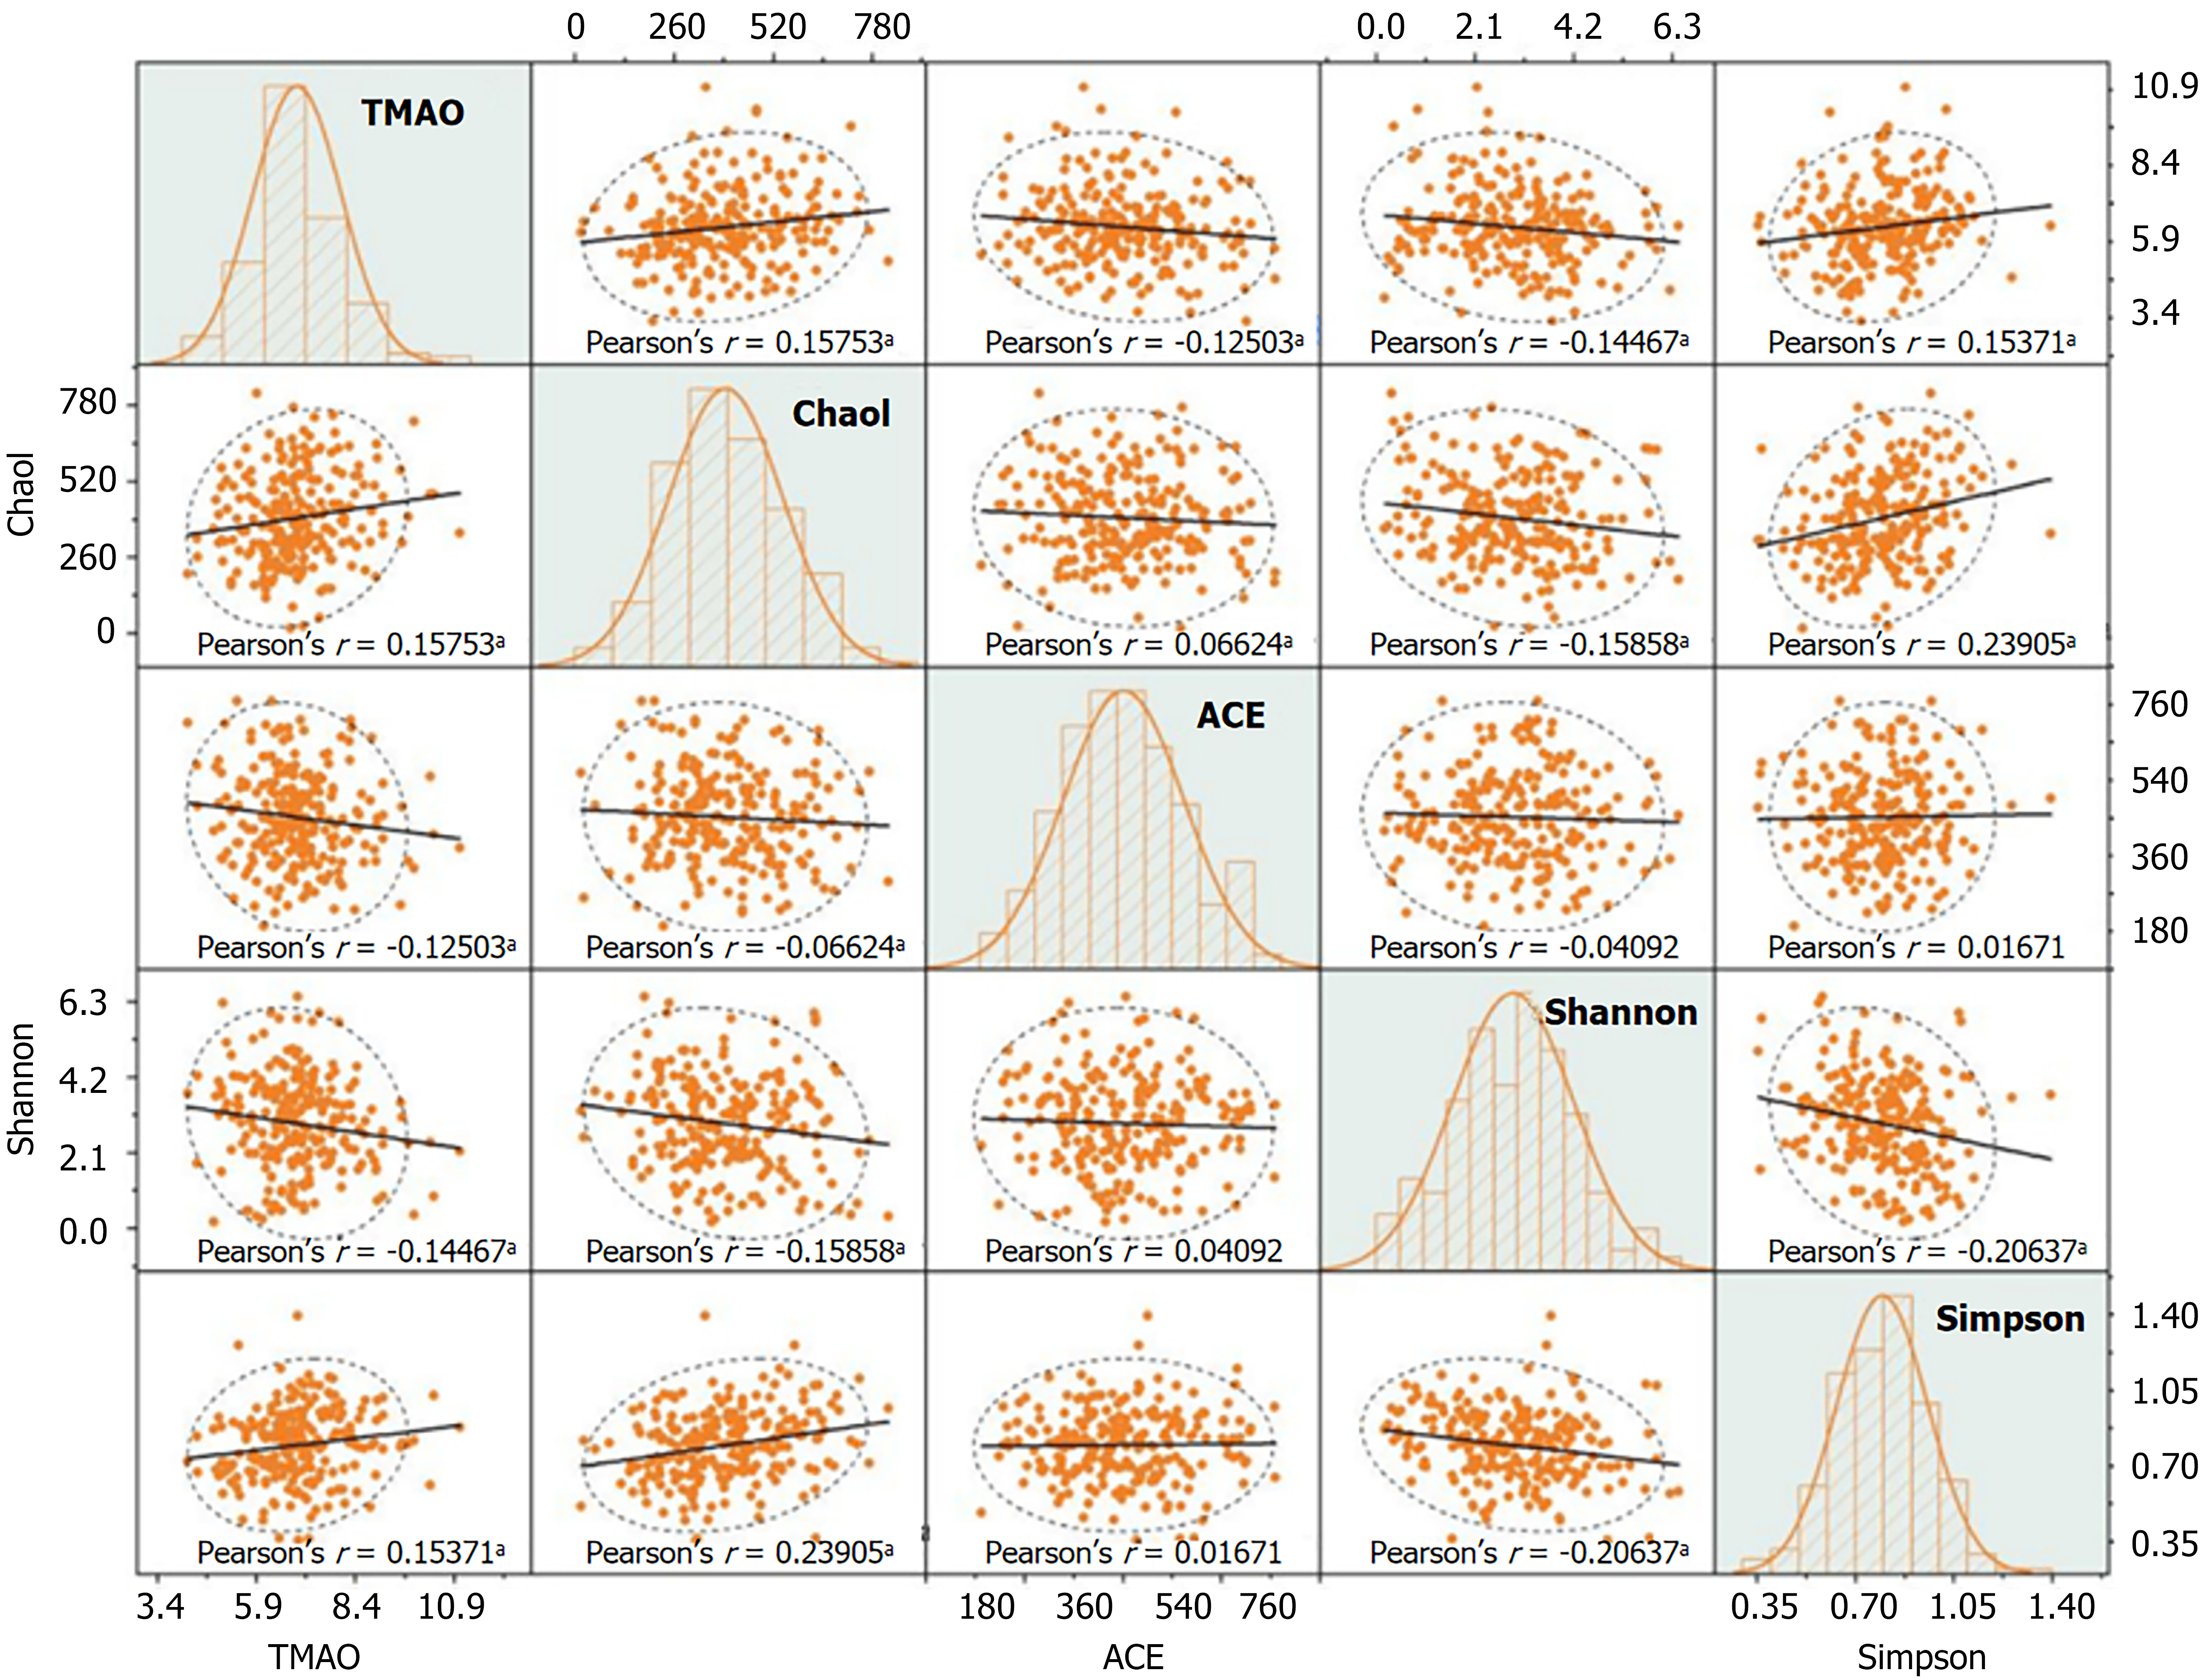
Figure 3 Correlation analysis between trimethylamine N-oxide and gastrointestinal flora abundance in patients with diabetic nephro
- Citation: Pan ZL, Li MQ, Zhang J, Xue LY, Shi YP. Correlation of gut microbiota metabolite trimethylamine N-oxide with inflammatory levels and osteoporosis in patients with diabetic nephropathy. World J Diabetes 2025; 16(11): 109919
- URL: https://www.wjgnet.com/1948-9358/full/v16/i11/109919.htm
- DOI: https://dx.doi.org/10.4239/wjd.v16.i11.109919