
















©The Author(s) 2025.
World J Diabetes. Nov 15, 2025; 16(11): 109455
Published online Nov 15, 2025. doi: 10.4239/wjd.v16.i11.109455
Published online Nov 15, 2025. doi: 10.4239/wjd.v16.i11.109455
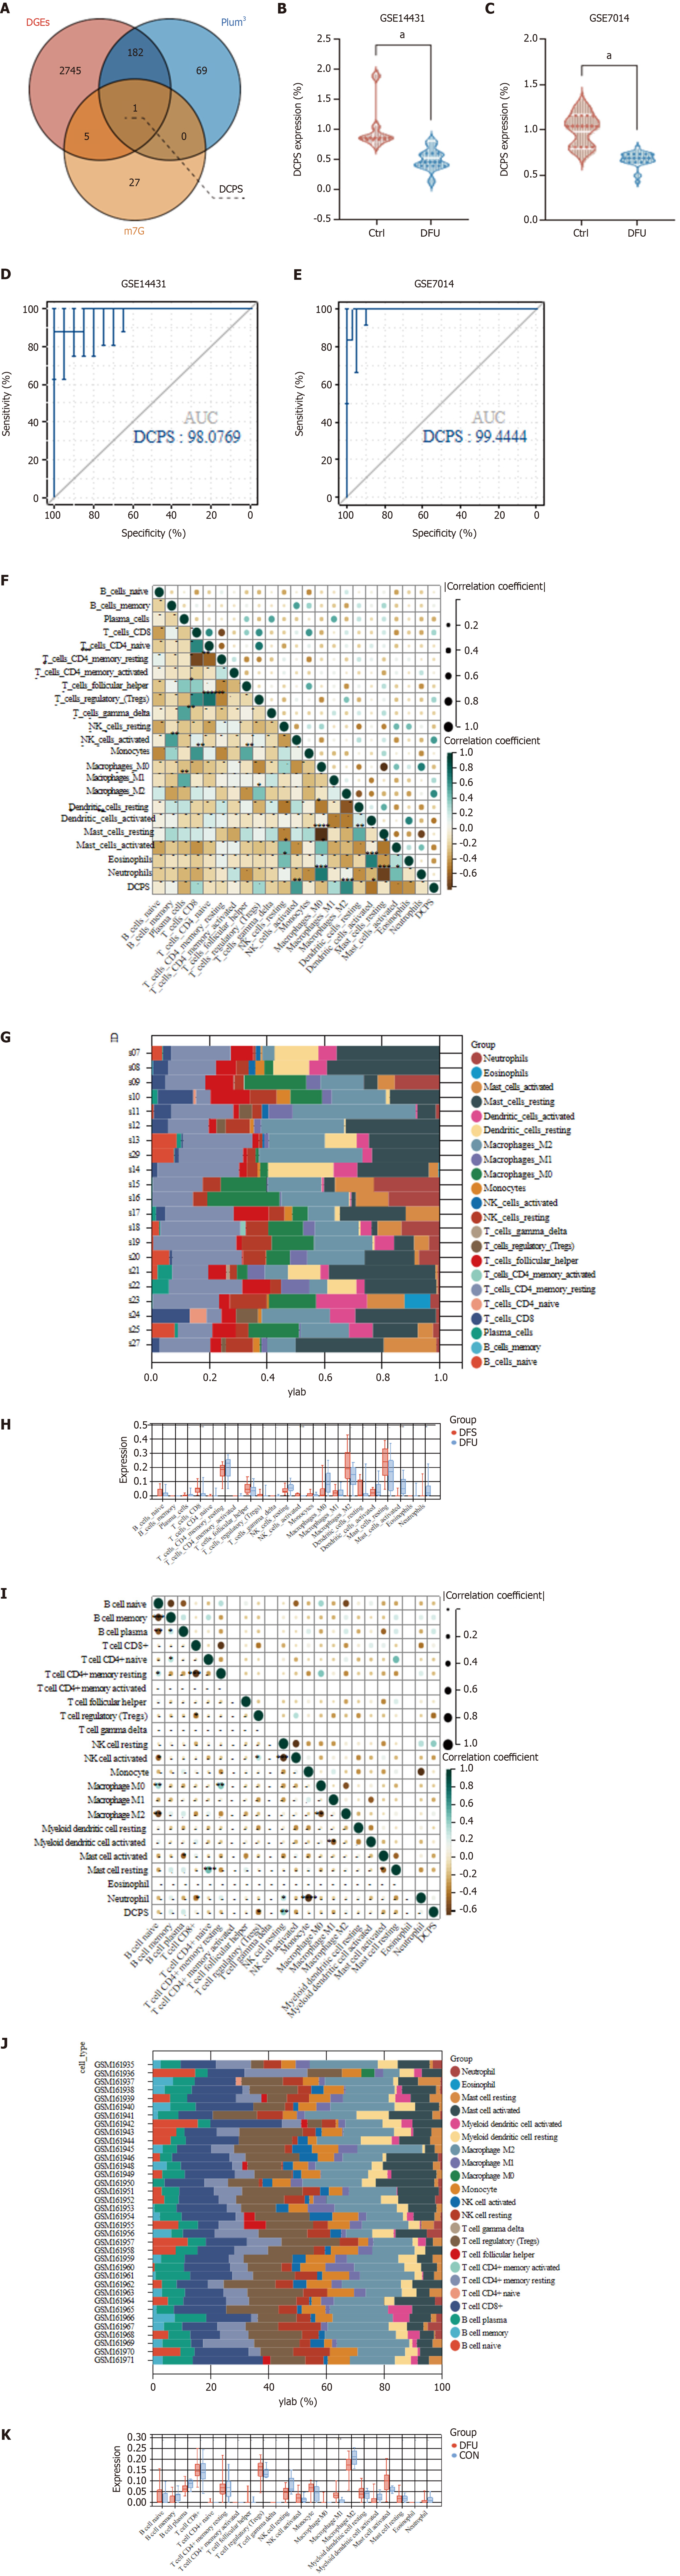
Figure 4 Immune cell infiltration and correlation analysis in decapping scavenger enzyme and diabetic foot ulcer.
A: Venn diagram illustrated the intersection among differentially expressed genes, the plum3 module, and N7-methylguanosine (m7G)-related genes, identifying decapping scavenger enzyme (DCPS) as a key candidate gene within the m7G-diabetic foot ulcer (DFU) category. In this diagram, red denotes differentially expressed genes, blue signifies plum3, and yellow indicates genes from the m7G; B: Differences in DCPS gene expression between DFU and control groups within the training set; C: Differences in DCPS gene expression between DFU and control groups in the validation set GSE7014; D: Receiver operating characteristic curve for DCPS in GSE134431; E: Receiver operating characteristic curve of DCPS in GSE7014; F-H: Stacked bar chart of the immune cell, the correlation matrix of immune cell proportions and the box plot of the DCPS related immune cell proportions in data set GSE134431; I-K: Stacked bar chart of the immune cell, the correlation matrix of immune cell proportions and the box plot of the DCPS related immune cell proportions in data set GSE7014. m7G: N7-methylguanosine; DCPS: Decapping scavenger enzyme; DGEs: Differentially expressed genes; DFU: Diabetic foot ulcer; NK cell: Natural killer cell.
- Citation: Xiao FG, Yang Z, Yu SY, Li Q, Huang PC, Huang GB, Li XG, Ran JL, Rui SL, Deng WQ. N7-methylguanosine-related gene decapping scavenger enzymes as a novel biomarker regulating epithelial cell function in diabetic foot ulcers. World J Diabetes 2025; 16(11): 109455
- URL: https://www.wjgnet.com/1948-9358/full/v16/i11/109455.htm
- DOI: https://dx.doi.org/10.4239/wjd.v16.i11.109455