
















©The Author(s) 2025.
World J Diabetes. Nov 15, 2025; 16(11): 109455
Published online Nov 15, 2025. doi: 10.4239/wjd.v16.i11.109455
Published online Nov 15, 2025. doi: 10.4239/wjd.v16.i11.109455
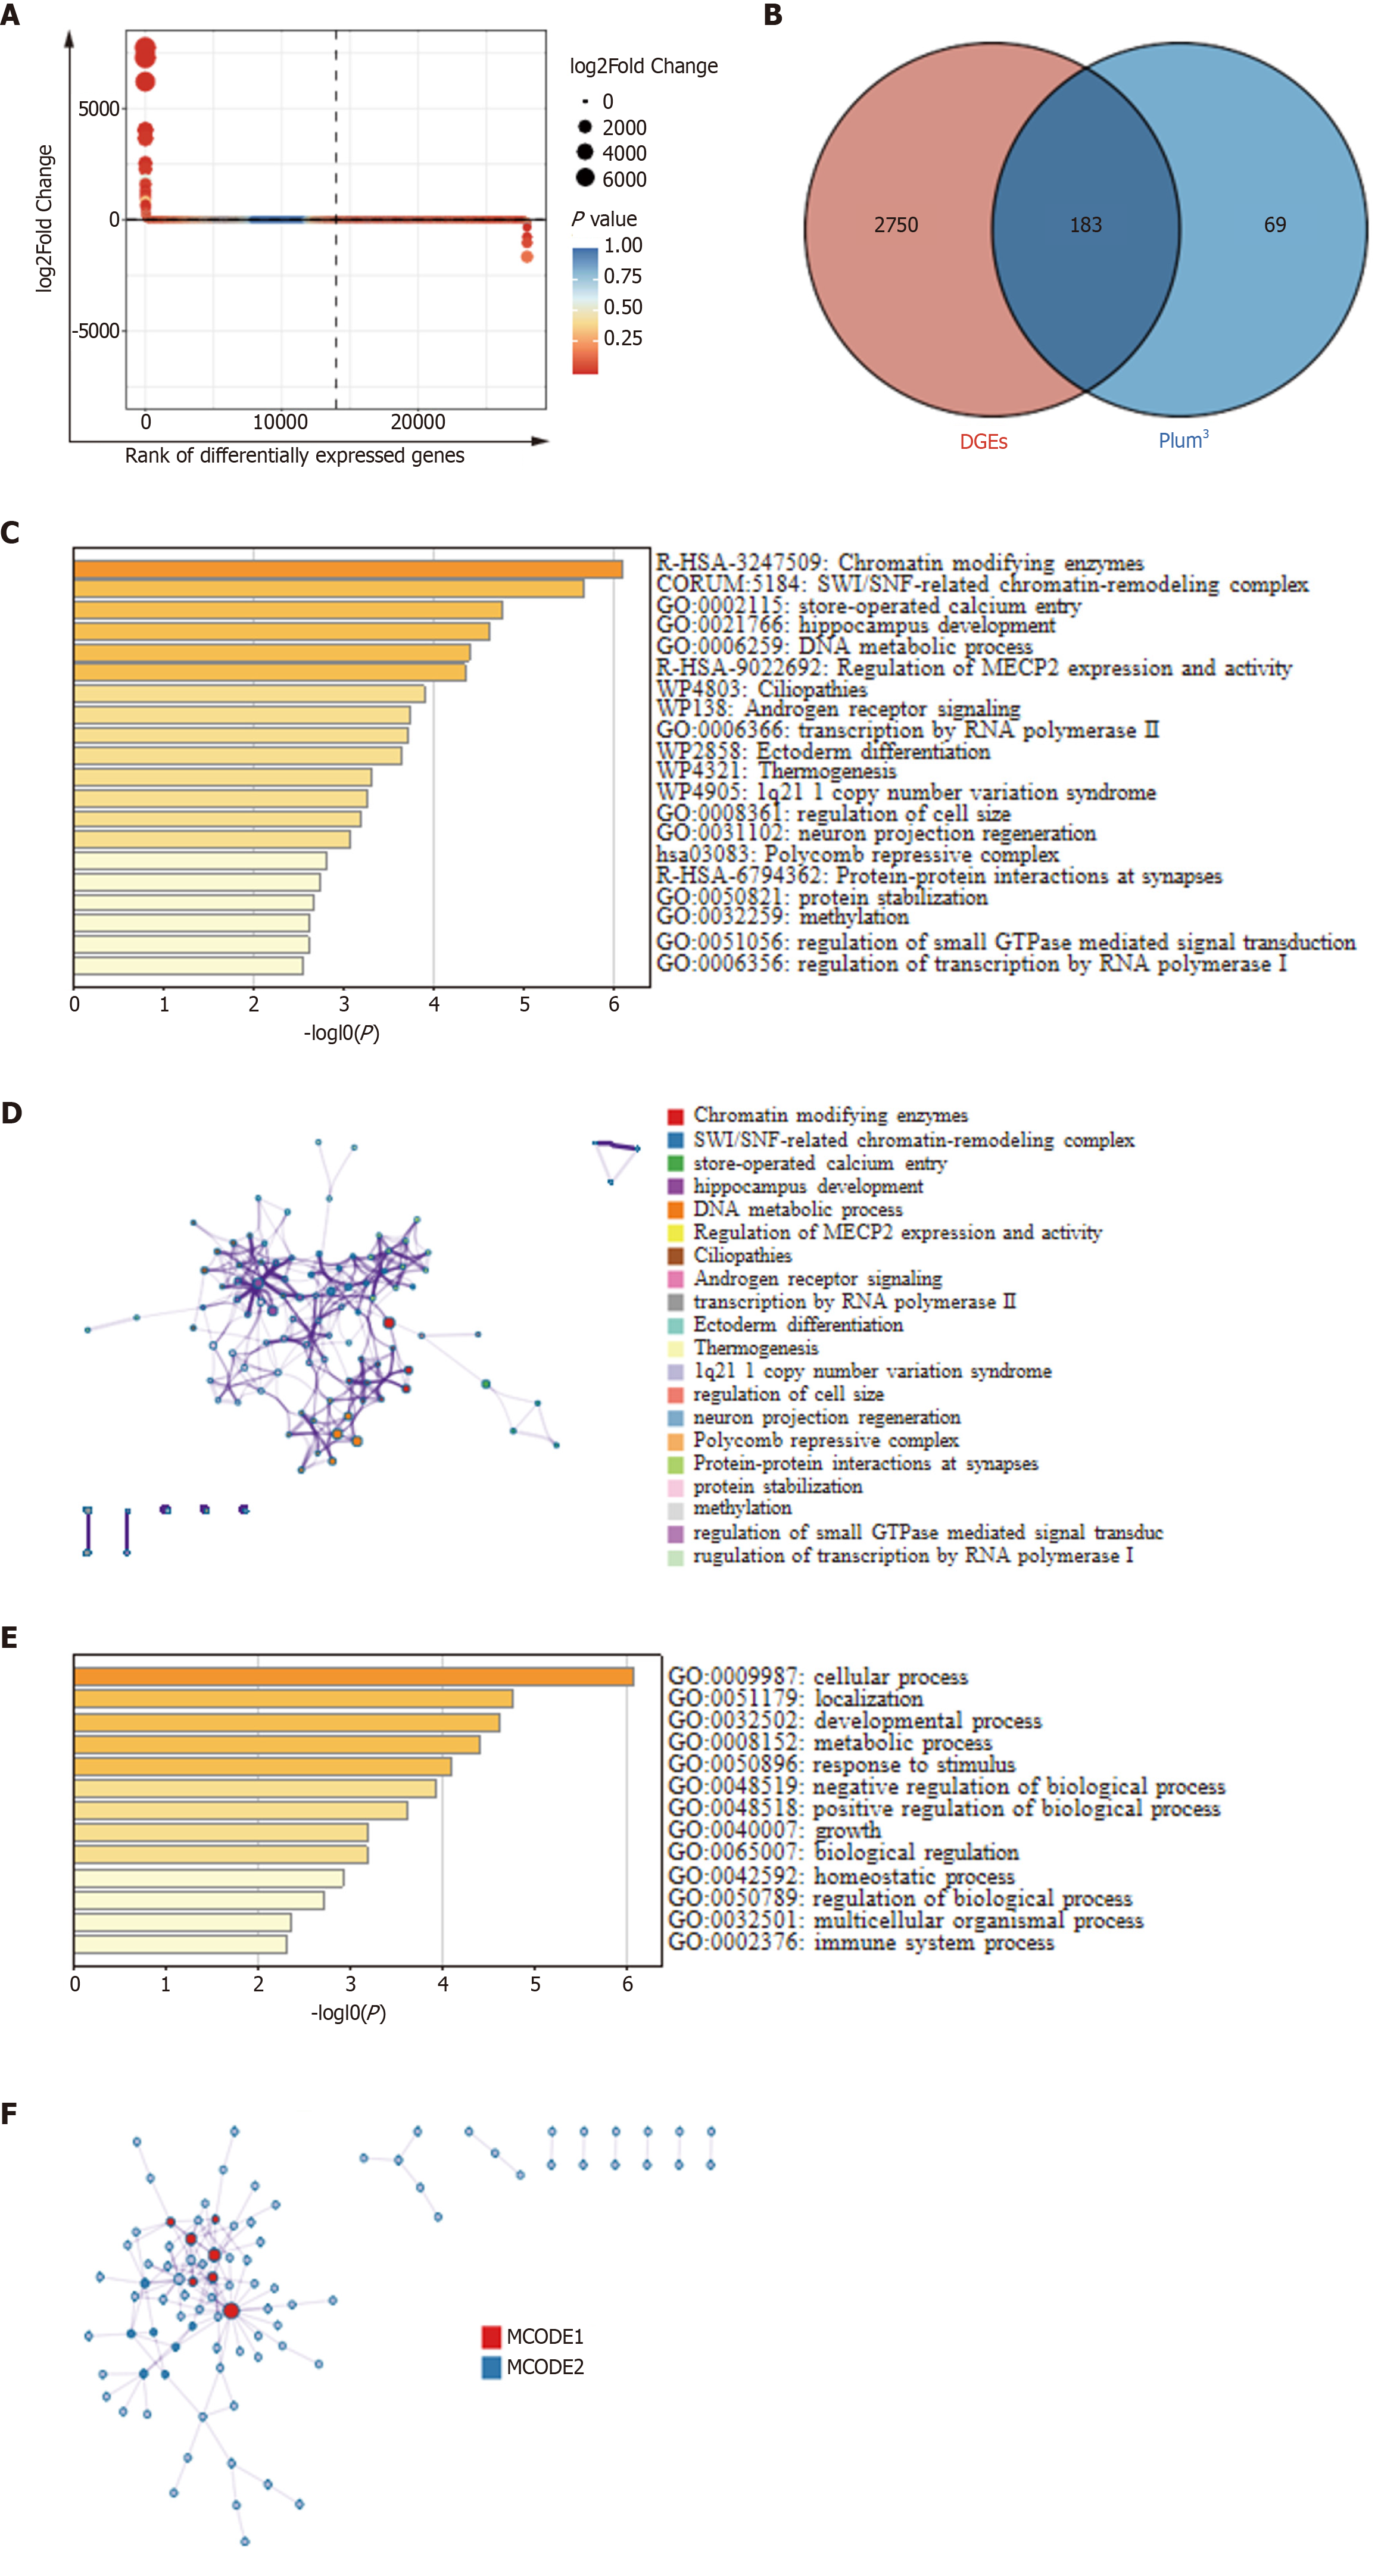
Figure 3 Gene annotation and enrichment analysis.
A: Differentially expressed genes (DEGs) analysis between diabetic foot ulcer group and control group; B: Venn diagram illustrated the intersection among DEGs and the plum3 module, and a total of 183 candidate genes were obtained for subsequent analysis. In this diagram, red denotes DEGs, and blue signifies plum3; C: Metascape bar graph for viewing top nonredundant enrichment clusters, one per cluster, using a discrete color scale to represent statistical significance; D: Network of enriched terms, colored by cluster ID, where nodes that share the same cluster ID are typically close to each other; E: Top-level Gene Ontology biological processes; F: Protein-protein interaction network and molecular complex detection components identified in the gene lists. DGEs: Differentially expressed genes; MECP2: Methyl CpG binding protein 2; GTPase: Guanosine triphosphatase; MCODE: Molecular complex detection.
- Citation: Xiao FG, Yang Z, Yu SY, Li Q, Huang PC, Huang GB, Li XG, Ran JL, Rui SL, Deng WQ. N7-methylguanosine-related gene decapping scavenger enzymes as a novel biomarker regulating epithelial cell function in diabetic foot ulcers. World J Diabetes 2025; 16(11): 109455
- URL: https://www.wjgnet.com/1948-9358/full/v16/i11/109455.htm
- DOI: https://dx.doi.org/10.4239/wjd.v16.i11.109455