
















©The Author(s) 2025.
World J Diabetes. Oct 15, 2025; 16(10): 111212
Published online Oct 15, 2025. doi: 10.4239/wjd.v16.i10.111212
Published online Oct 15, 2025. doi: 10.4239/wjd.v16.i10.111212
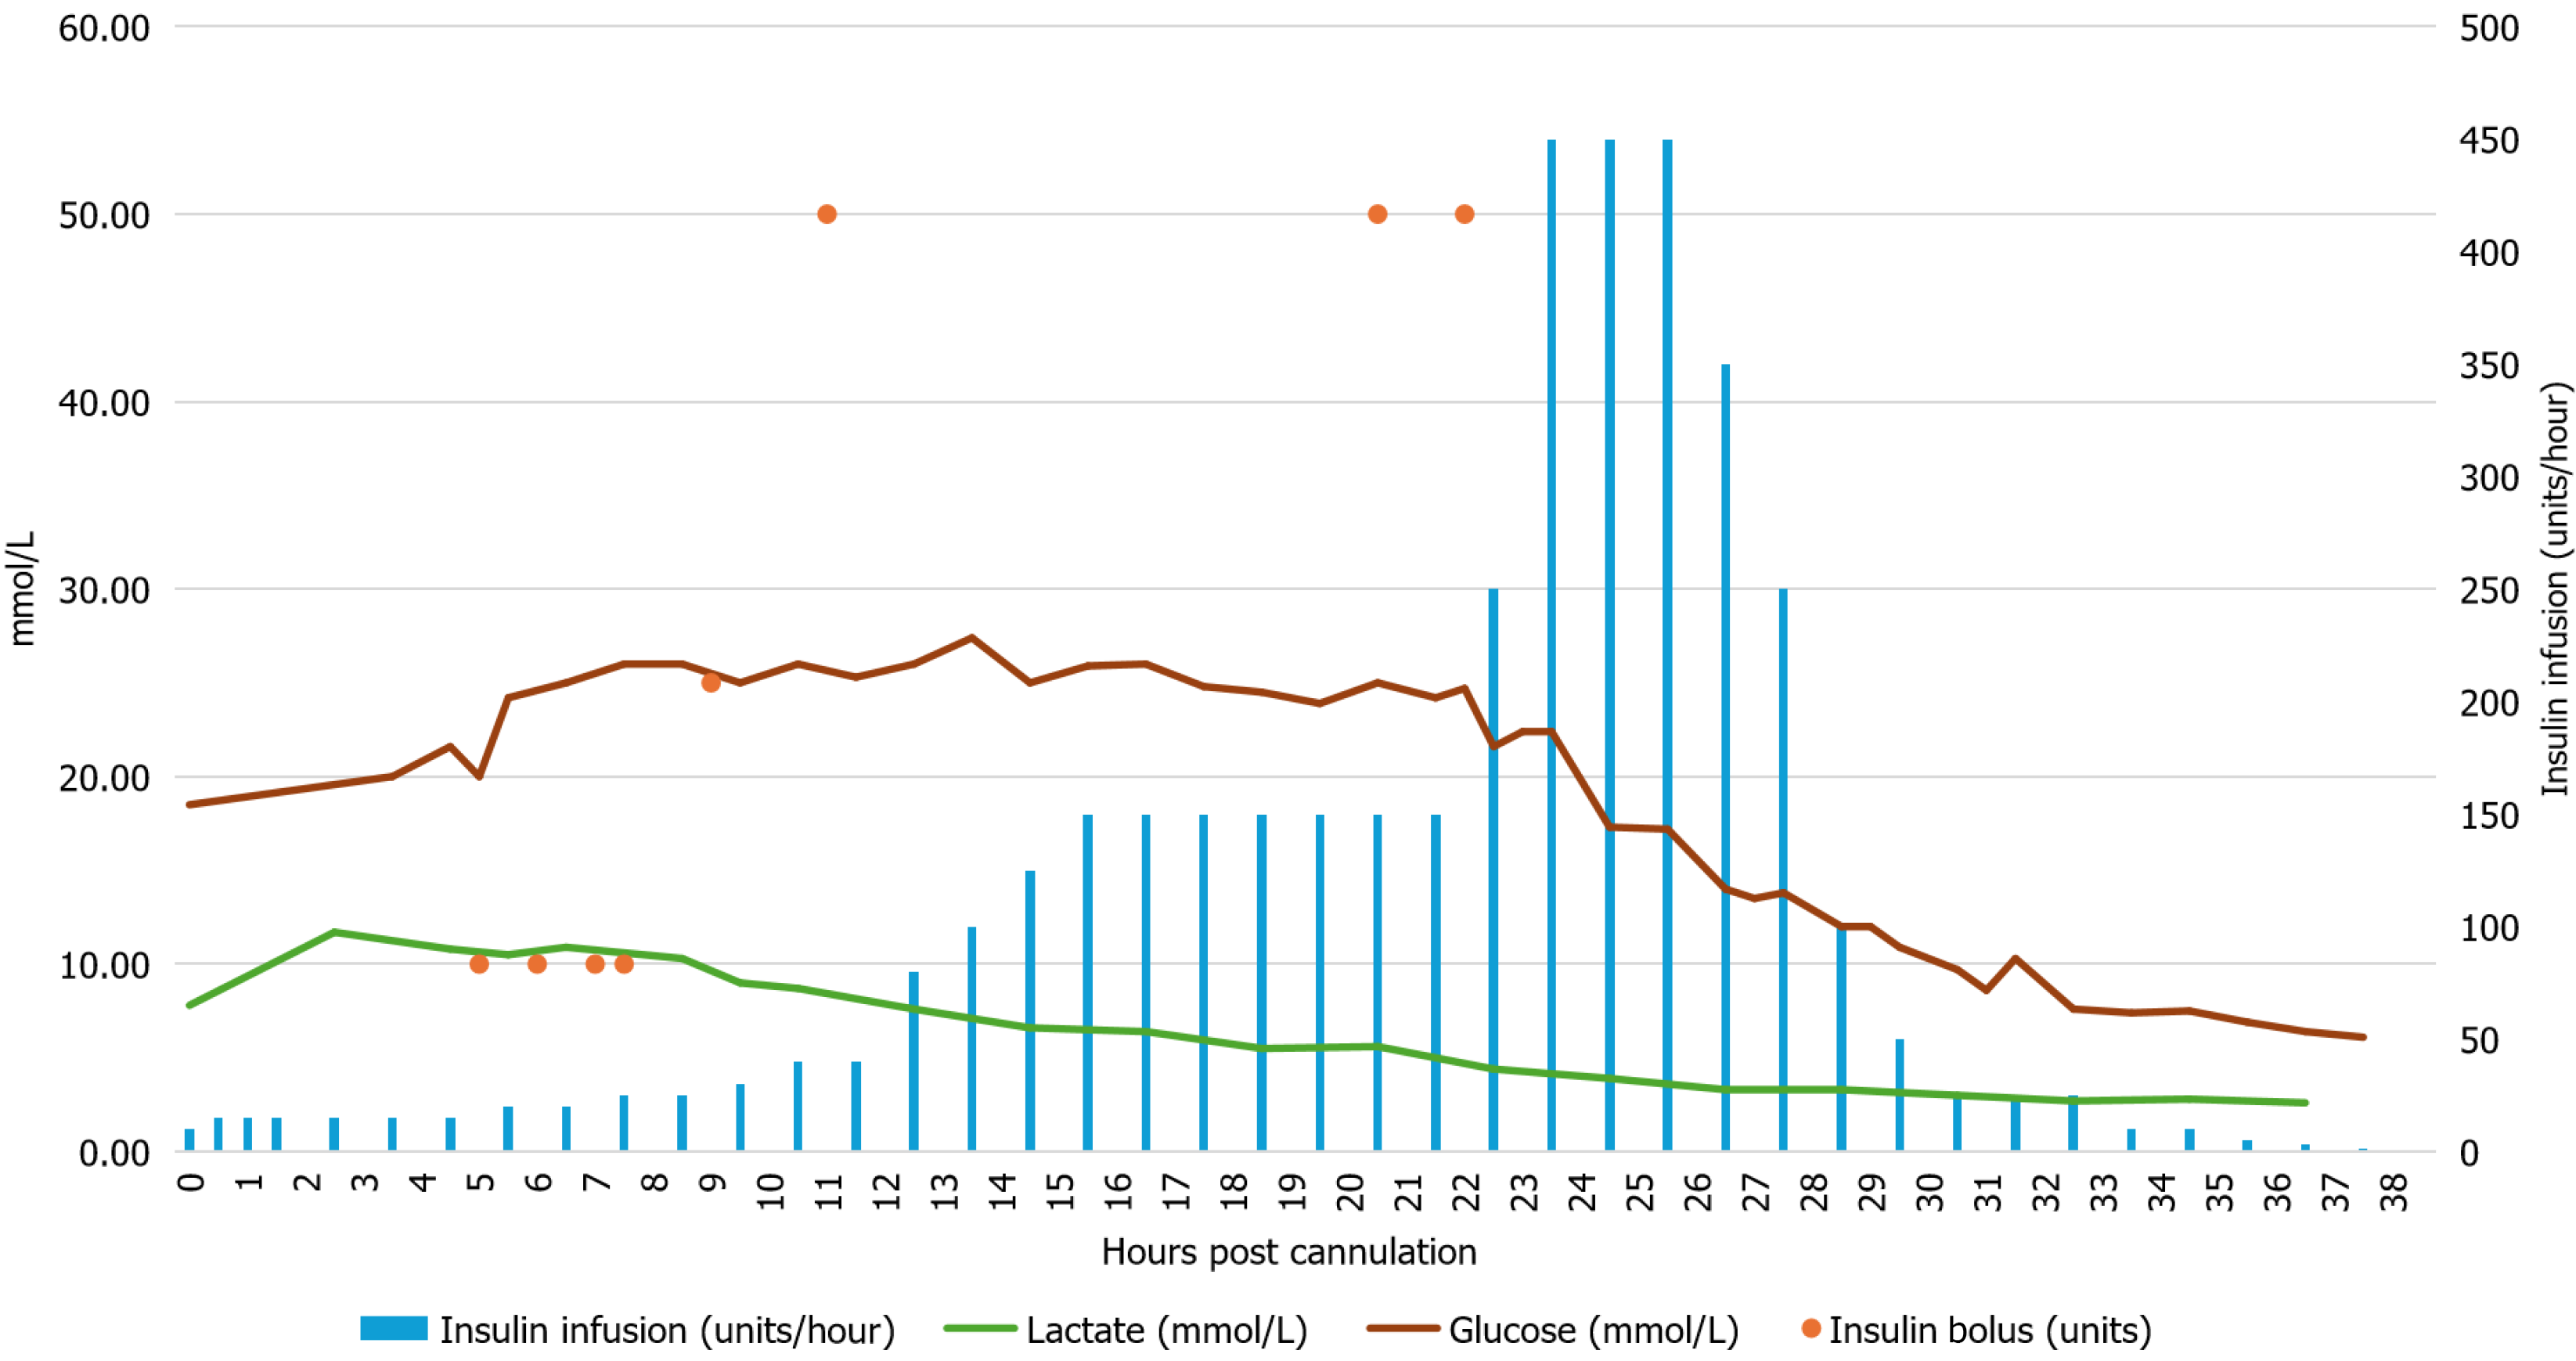
Figure 1 Blood glucose levels (maroon, left Y-axis), serum lactate levels (green, left Y-axis), insulin bolus (orange, left Y-axis) compared with insulin infusion rates (blue, right Y-axis) since start of veno-arterial extracorporeal membrane oxygenation.
- Citation: Butler PW, Légaré JF, White CW. Transient extreme insulin resistance in a patient requiring extracorporeal membrane oxygenation for cardiogenic shock: A case report. World J Diabetes 2025; 16(10): 111212
- URL: https://www.wjgnet.com/1948-9358/full/v16/i10/111212.htm
- DOI: https://dx.doi.org/10.4239/wjd.v16.i10.111212