
















©The Author(s) 2025.
World J Diabetes. Oct 15, 2025; 16(10): 110631
Published online Oct 15, 2025. doi: 10.4239/wjd.v16.i10.110631
Published online Oct 15, 2025. doi: 10.4239/wjd.v16.i10.110631
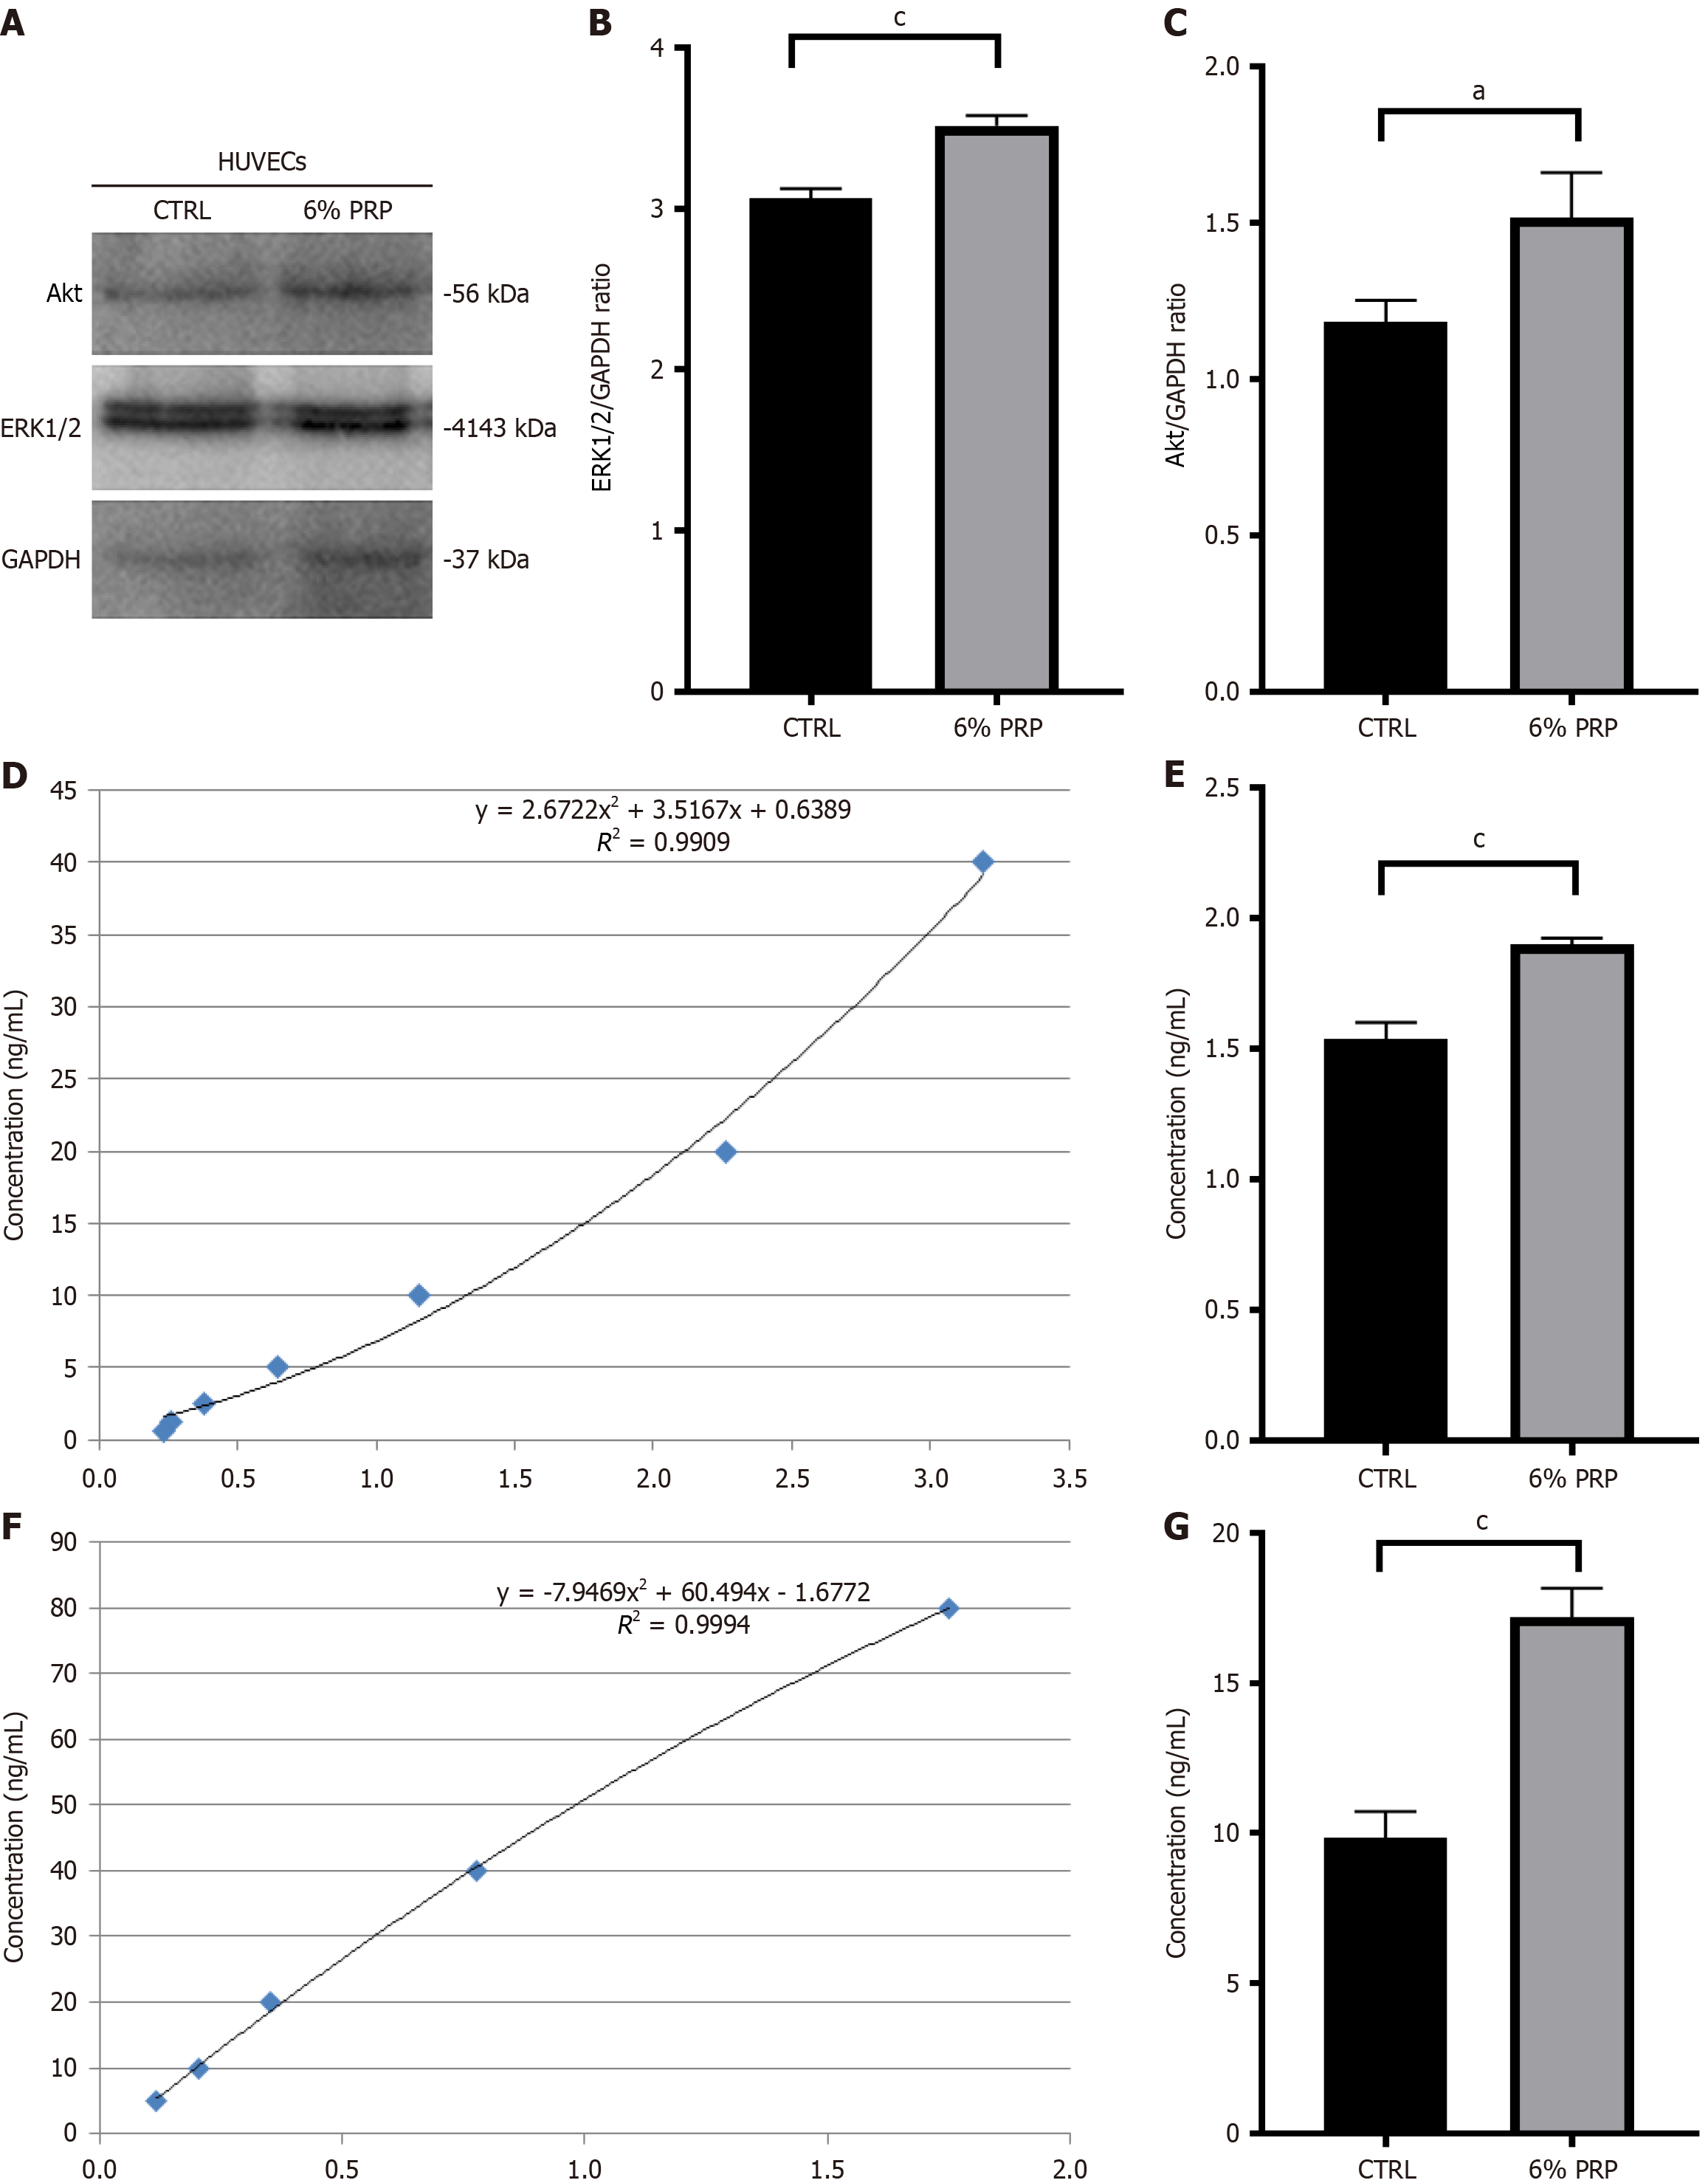
Figure 5 Validation of the vascular endothelial growth factor receptor signaling pathway in human umbilical vein endothelial cells.
A: Visualization of the relative expression levels of Ak strain transforming (Akt) and extracellular regulated protein kinases 1/2 (ERK1/2) in human umbilical vein endothelial cells (HUVECs) in each treatment group; B: Statistical analysis of the relative expression levels of ERK1/2 in HUVECs in each treatment group; C: Statistical analysis of the relative expression levels of Akt in HUVECs in each treatment group; D: Standard curve of vascular endothelial growth factor receptor (VEGFR2); E: Analysis of VEGFR2 expression levels in HUVECs in each treatment group; F: Standard curve of p38; G: Analysis of p38 expression levels in HUVECs in each treatment group. Significant differences in experimental data were analyzed using t tests, and all assays were performed in triplicate. aP < 0.05 vs the control (CTRL) group; cP < 0.001 vs the CTRL group. Akt: Ak strain transforming; ERK1/2: Extracellular regulated protein kinases 1/2; HUVECs: Human umbilical vein endothelial cells; PRP: Platelet-rich plasma; CTRL: The control group.
- Citation: Huang C, Liu HZ, Liang JB, Zhao W, Wang YS, Ruan LF, Zhuang WZ, Li YS, Wang Q, Tang YK. In vitro and clinical evaluation of platelet-rich plasma combined with angioplasty in diabetic foot treatment. World J Diabetes 2025; 16(10): 110631
- URL: https://www.wjgnet.com/1948-9358/full/v16/i10/110631.htm
- DOI: https://dx.doi.org/10.4239/wjd.v16.i10.110631