
















©The Author(s) 2025.
World J Diabetes. Oct 15, 2025; 16(10): 110138
Published online Oct 15, 2025. doi: 10.4239/wjd.v16.i10.110138
Published online Oct 15, 2025. doi: 10.4239/wjd.v16.i10.110138
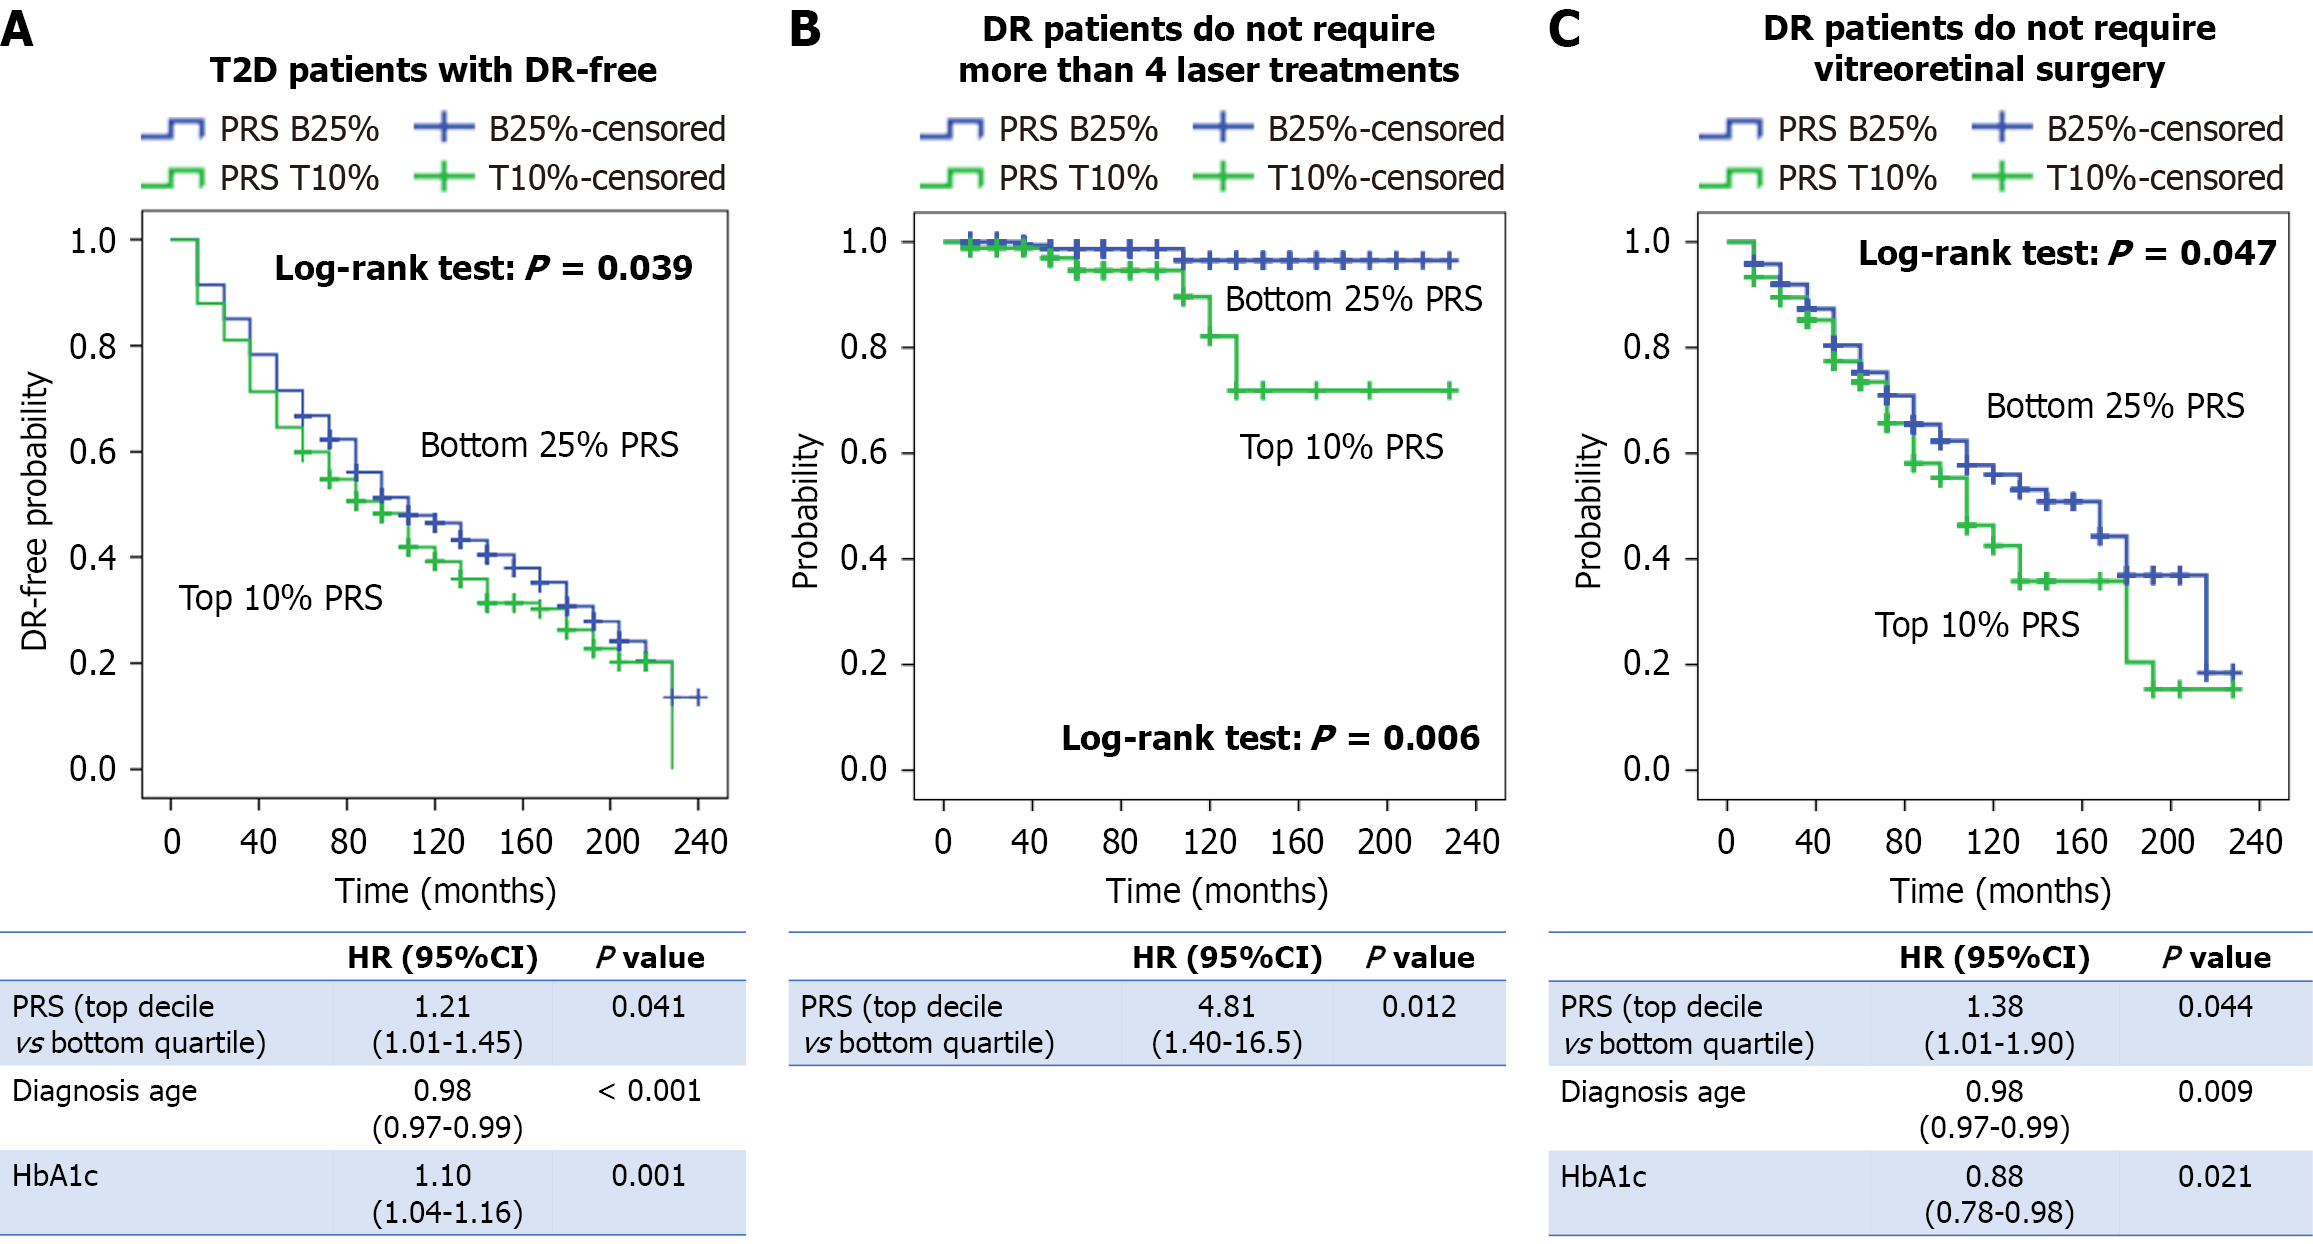
Figure 2 Kaplan-Meier curves depicting the probability over time in the bottom 25% (blue) and top 10% (green) groups of polygenic risk score.
A: Patients with type 2 diabetes remaining diabetic retinopathy (DR)-free; B: Patients with DR not requiring more than four laser treatments; C: Patients with DR not requiring vitreoretinal surgery. Hazard ratios for patients in the top 10% of polygenic risk score were estimated using a Cox regression model adjusted for diagnosis age and glycated hemoglobin A1c. T2D: Type 2 diabetes; DR: Diabetic retinopathy; PRS: Polygenic risk score; HR: Hazard ratio; CI: Confidence interval; HbA1c: Glycated hemoglobin A1c.
- Citation: Huang YC, Liao WL, Lin HJ, Huang YT, Chang YW, Yang JS, Weng AL, Tsai FJ. Polygenic risk score for predicting diabetic retinopathy in patients with type 2 diabetes: A twenty-year follow-up study. World J Diabetes 2025; 16(10): 110138
- URL: https://www.wjgnet.com/1948-9358/full/v16/i10/110138.htm
- DOI: https://dx.doi.org/10.4239/wjd.v16.i10.110138