
















©The Author(s) 2025.
World J Diabetes. Oct 15, 2025; 16(10): 109568
Published online Oct 15, 2025. doi: 10.4239/wjd.v16.i10.109568
Published online Oct 15, 2025. doi: 10.4239/wjd.v16.i10.109568
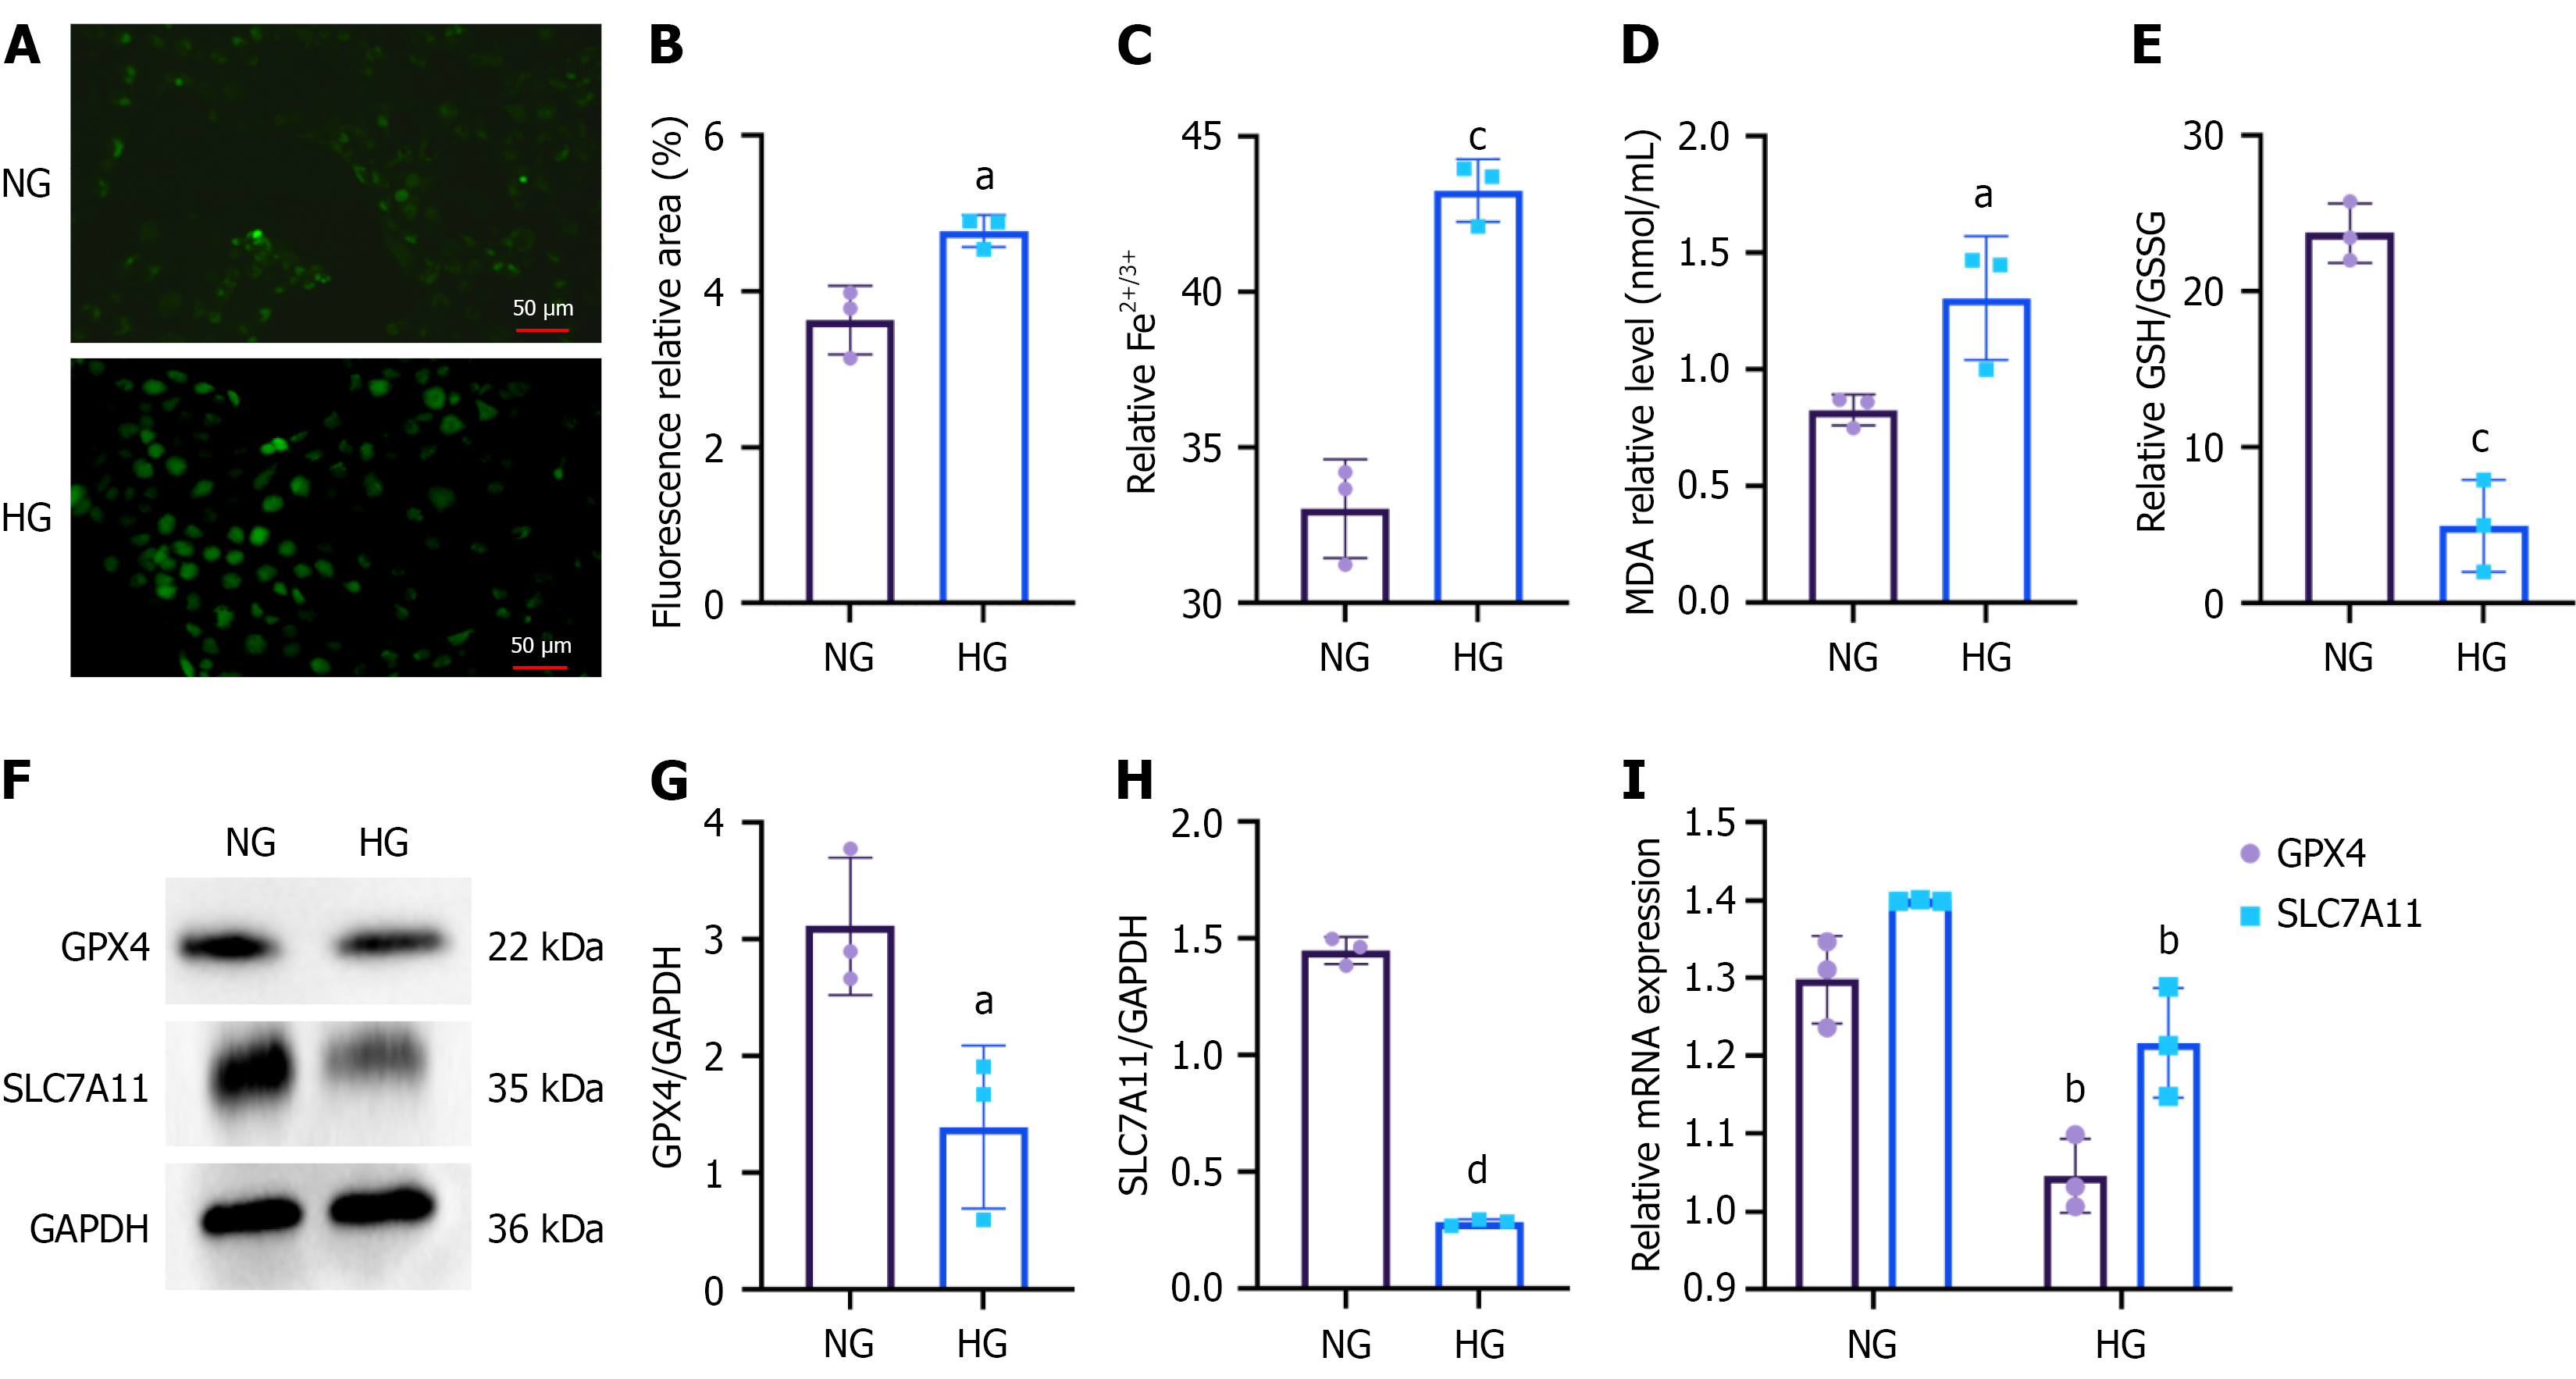
Figure 7 Ferroptosis in human kidney-2 cells under high-glucose conditions.
A: Intracellular reactive oxygen species levels in the normal (NG) and high glucose (HG) groups were visualized using fluorescence microscopy (scale bars = 50 μm); B: Quantification of reactive oxygen species fluorescence intensity (expressed as relative fluorescent area%) in the NG and HG groups; C: Intracellular iron (Fe2+/Fe3+) levels in the NG and HG groups; D: Malondialdehyde levels in the NG and HG groups; E: Glutathione to oxidized glutathione ratio in the NG and HG groups; F-I: Expression levels of ferroptosis-related markers glutathione peroxidase 4 and recombinant solute carrier family 7 member 11 were analyzed by Western blot and quantitative reverse transcription-polymerase chain reaction in the NG and HG groups. NG: Normal group; HG: High glucose; MDA: Malondialdehyde; GSH: Glutathione; GSSG: Oxidized glutathione; GPX4: Glutathione peroxidase 4; SLC7A11: Solute carrier family 7 member 11; GAPDH: Glyceraldehyde 3-phosphate dehydrogenase. aP < 0.05 vs normal group, bP < 0.01 vs normal group, cP < 0.001 vs normal group, and dP < 0.0001 vs normal group.
- Citation: Song SY, Shan CC, Zhou PP, Xu WL, Tan Y, Zhou XQ, Huang LJ, Yan QH, Yu JY. Nephroprotective mechanism of Kunkui Baoshen decoction in diabetic kidney disease: Targeting the HERC2/NCOA4-mediated autophagy-dependent ferroptosis pathway. World J Diabetes 2025; 16(10): 109568
- URL: https://www.wjgnet.com/1948-9358/full/v16/i10/109568.htm
- DOI: https://dx.doi.org/10.4239/wjd.v16.i10.109568