
















©The Author(s) 2025.
World J Diabetes. Oct 15, 2025; 16(10): 109526
Published online Oct 15, 2025. doi: 10.4239/wjd.v16.i10.109526
Published online Oct 15, 2025. doi: 10.4239/wjd.v16.i10.109526
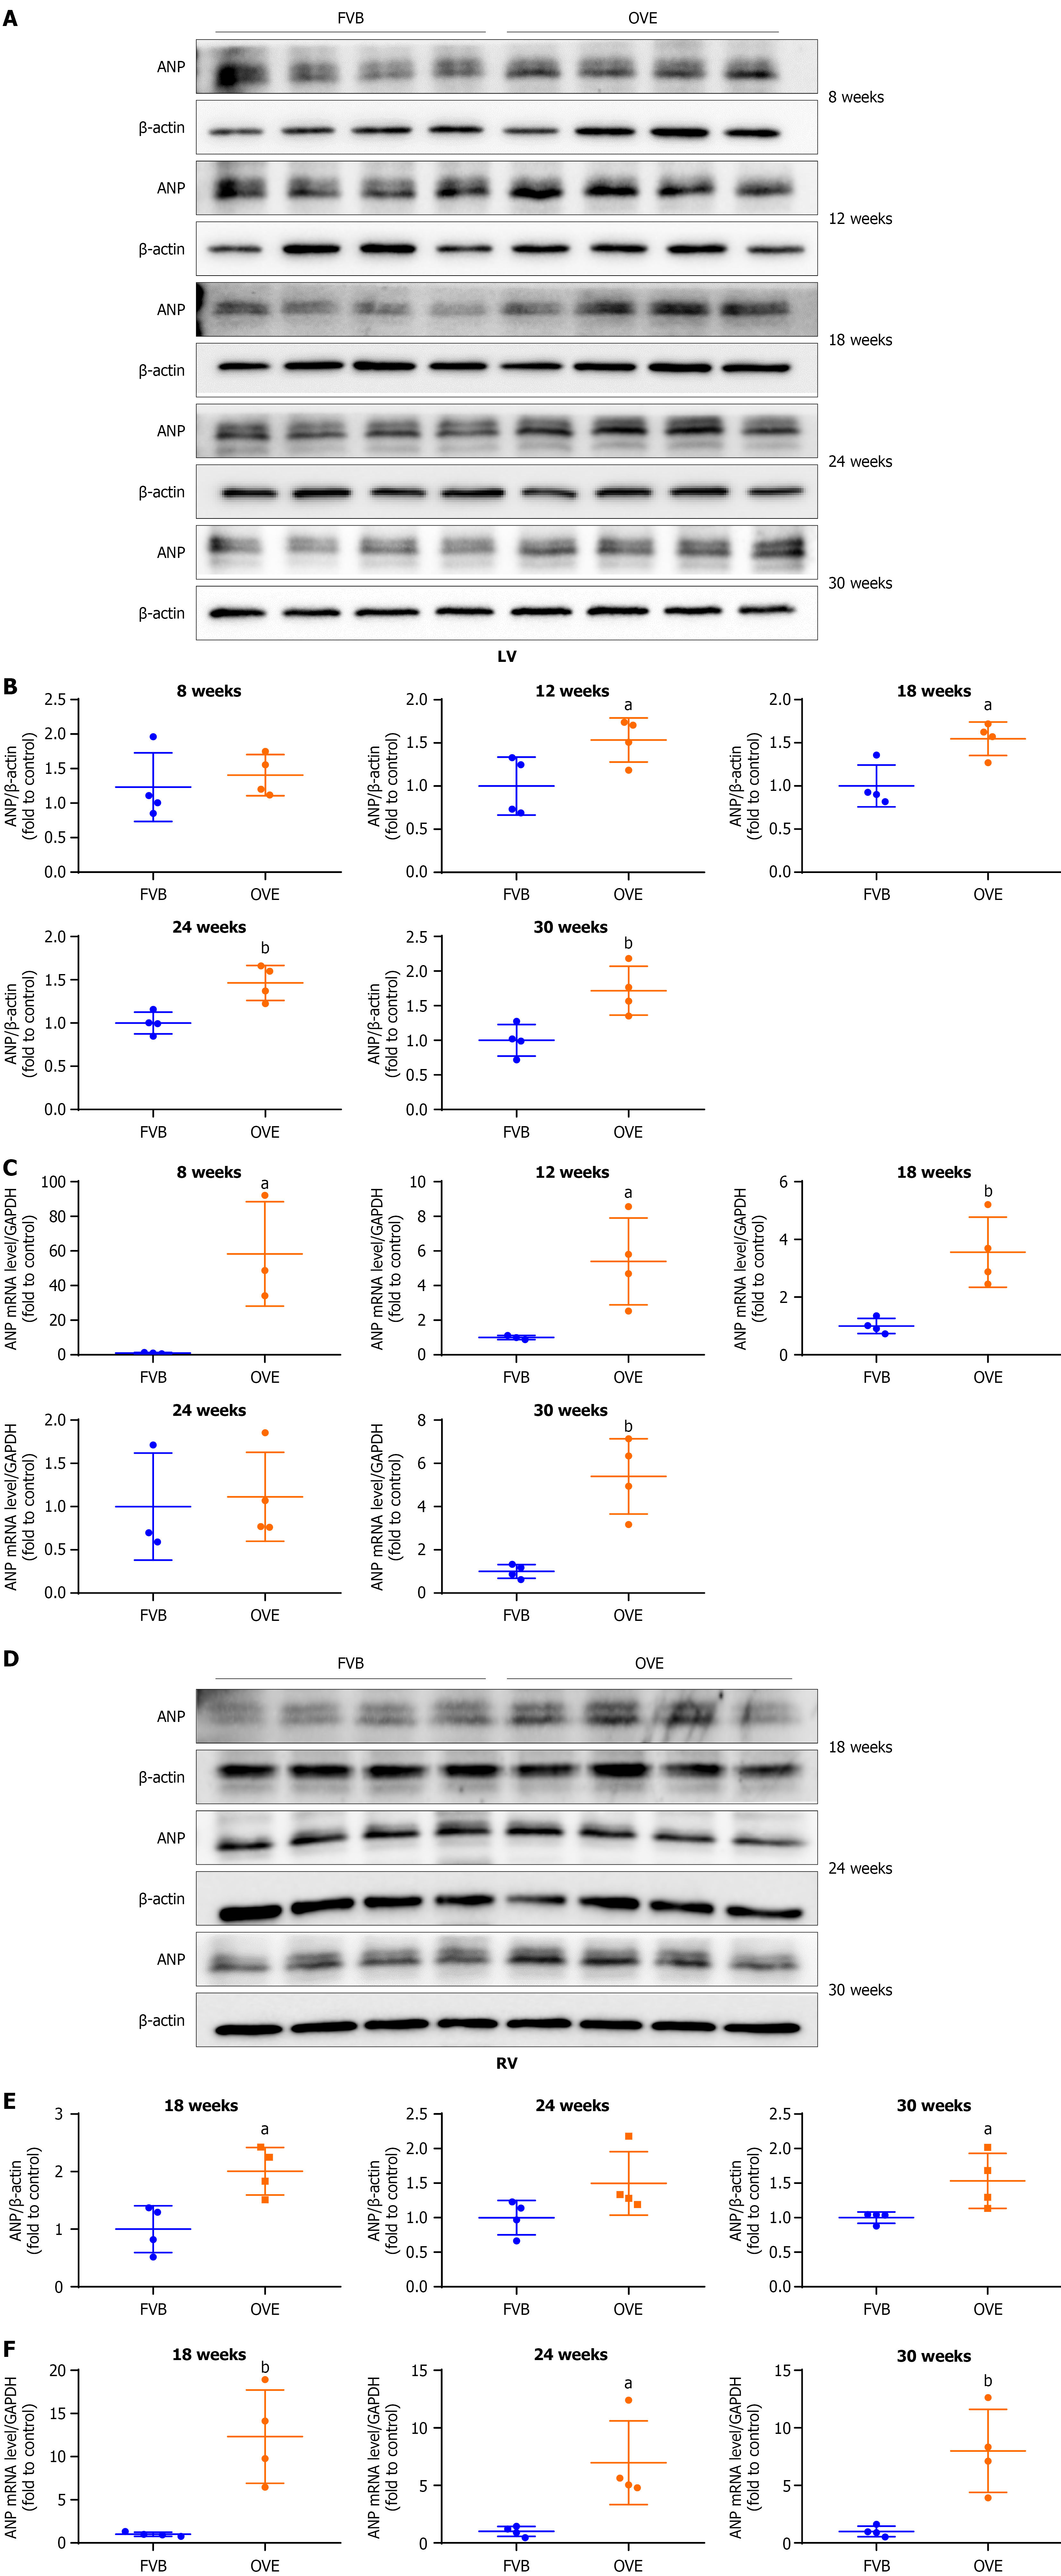
Figure 8 The impact of type 1 diabetes on cardiac hypertrophy in the left and right ventricles of OVE26 and FVB mice.
A and B: Changes in atrial natriuretic peptide protein levels in the left ventricle were assayed by Western blot; C: Changes in atrial natriuretic peptide mRNA expression in the left ventricle were measured by quantitative reverse transcription polymerase chain reaction; D and E: Changes in atrial natriuretic peptide protein levels in the right ventricle were assayed by Western blot; F: Changes in atrial natriuretic peptide mRNA expression in the right ventricle were measured by quantitative reverse transcription polymerase chain reaction. Data are presented as mean ± SD (n = 4). aP < 0.05 vs control FVB mice; bP < 0.01 vs control FVB mice. LV: Left ventricle; ANP: Atrial natriuretic peptide; RV: Right ventricle.
- Citation: Yu JJ, Han JG, Tan Y, Xu JX, LeBlanc A, Keller BB, Huang J, Cai L. Right ventricular dysfunctions in type 1 diabetic mice: A longitudinal study. World J Diabetes 2025; 16(10): 109526
- URL: https://www.wjgnet.com/1948-9358/full/v16/i10/109526.htm
- DOI: https://dx.doi.org/10.4239/wjd.v16.i10.109526