
















©The Author(s) 2024.
World J Diabetes. Jul 15, 2024; 15(7): 1562-1588
Published online Jul 15, 2024. doi: 10.4239/wjd.v15.i7.1562
Published online Jul 15, 2024. doi: 10.4239/wjd.v15.i7.1562
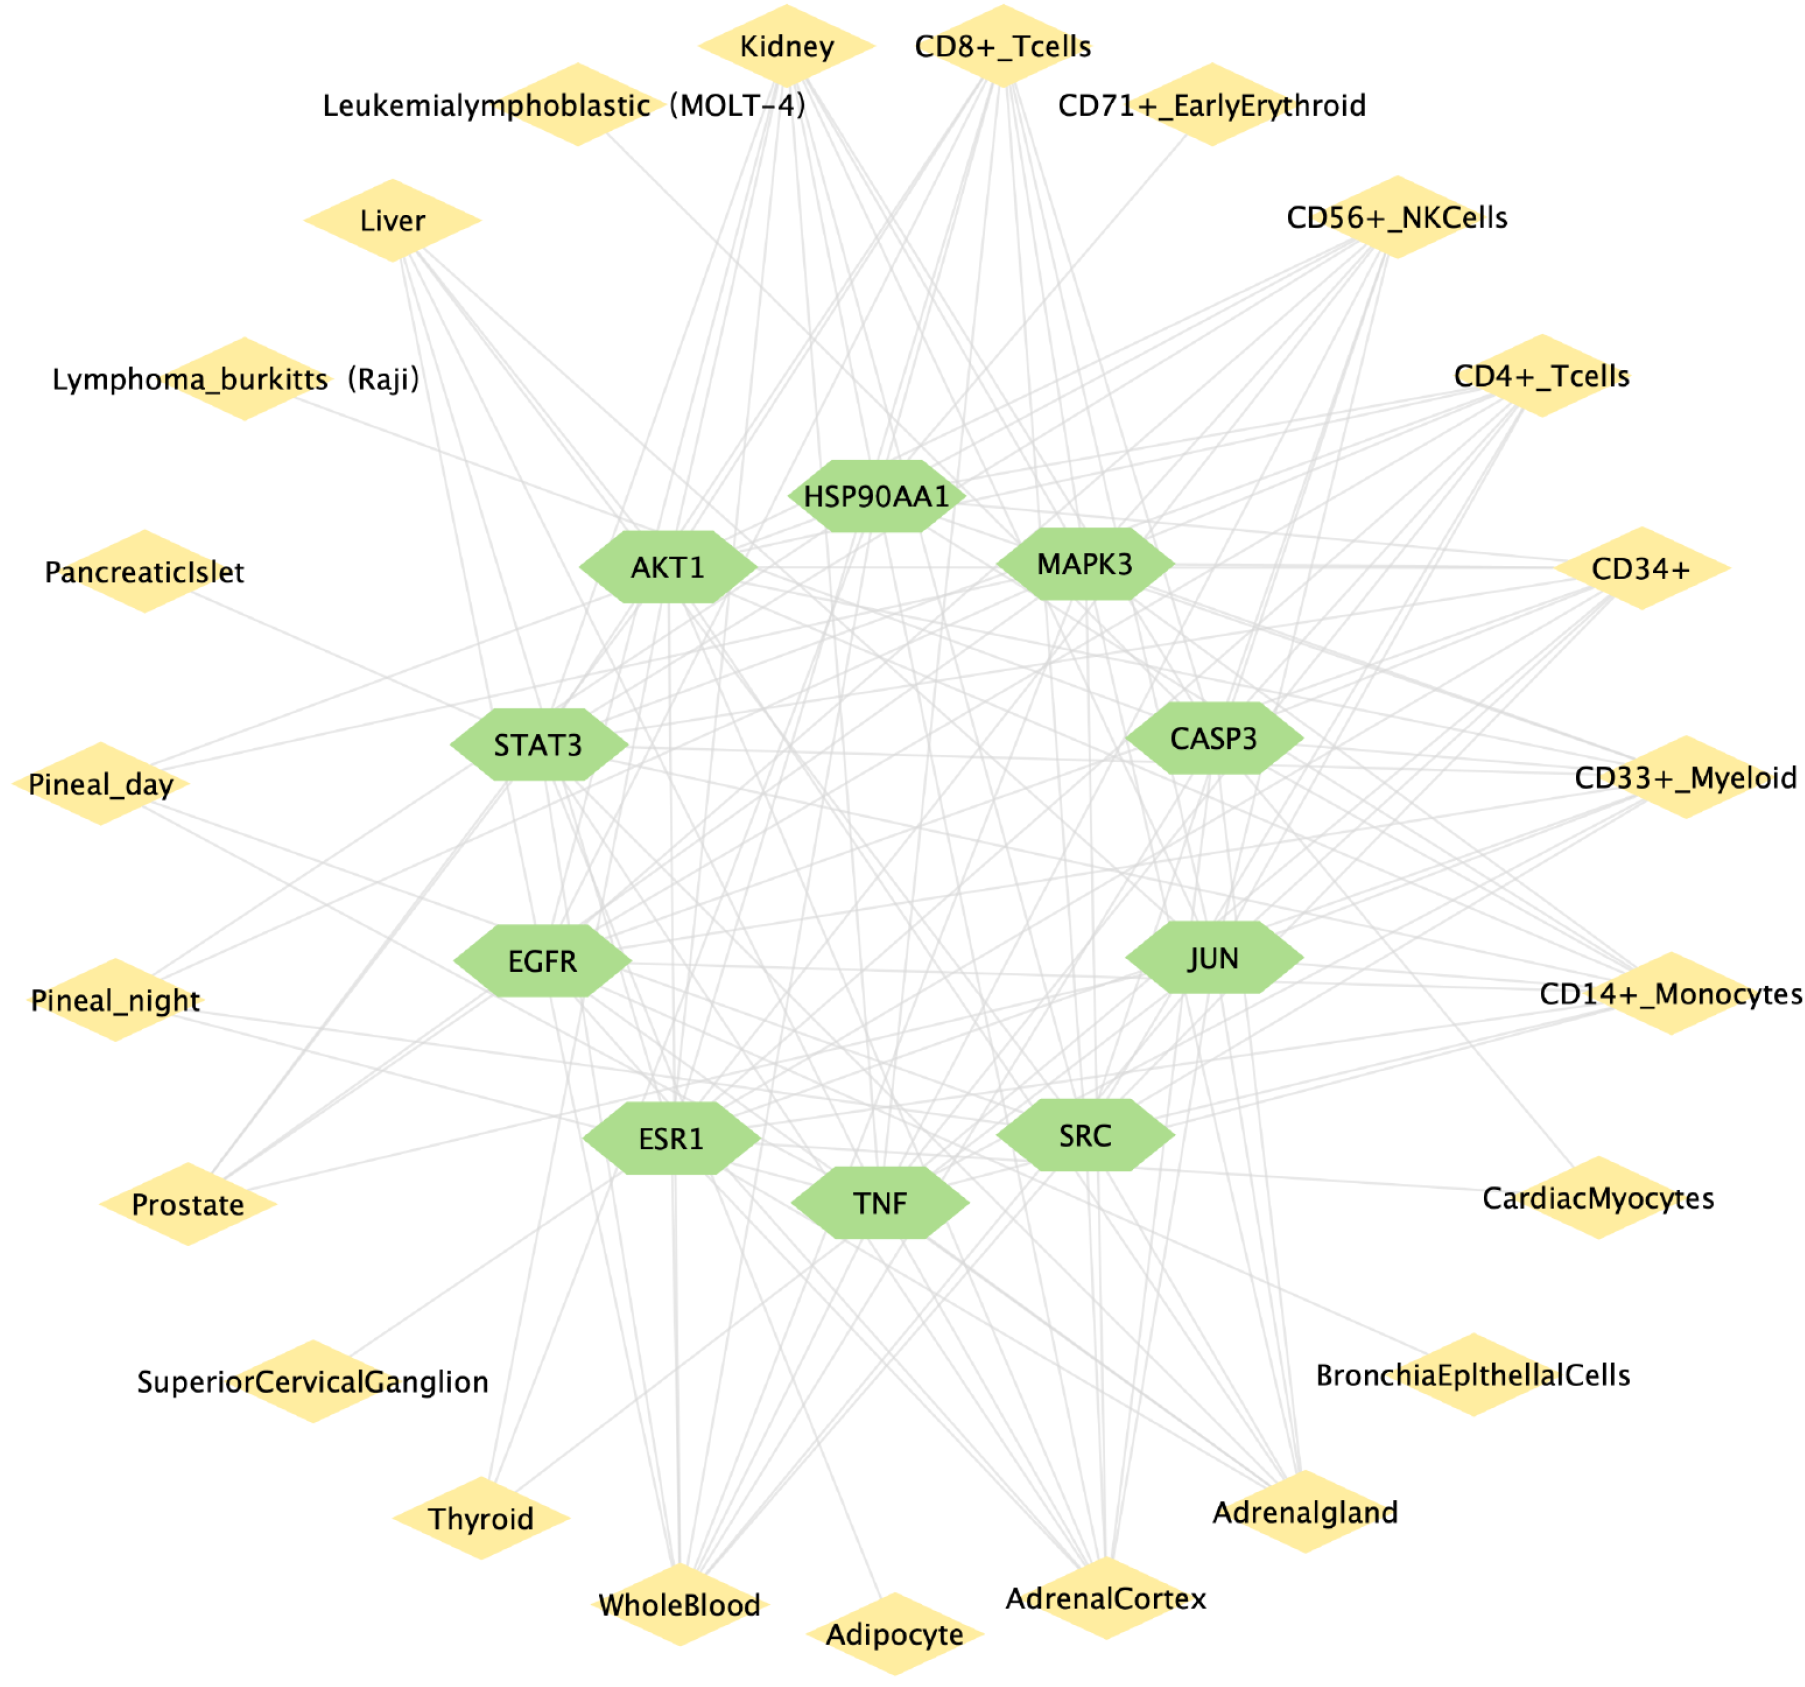
Figure 7 Diagram of the “key target-organ network”.
The green nodes represent the key targets, while the yellow nodes depict the organs. The edges symbolize the connections between these key targets and organs.
- Citation: Zhang MY, Zheng SQ. Network pharmacology and molecular dynamics study of the effect of the Astragalus-Coptis drug pair on diabetic kidney disease. World J Diabetes 2024; 15(7): 1562-1588
- URL: https://www.wjgnet.com/1948-9358/full/v15/i7/1562.htm
- DOI: https://dx.doi.org/10.4239/wjd.v15.i7.1562