Copyright
©The Author(s) 2024.
World J Diabetes. Apr 15, 2024; 15(4): 735-757
Published online Apr 15, 2024. doi: 10.4239/wjd.v15.i4.735
Published online Apr 15, 2024. doi: 10.4239/wjd.v15.i4.735
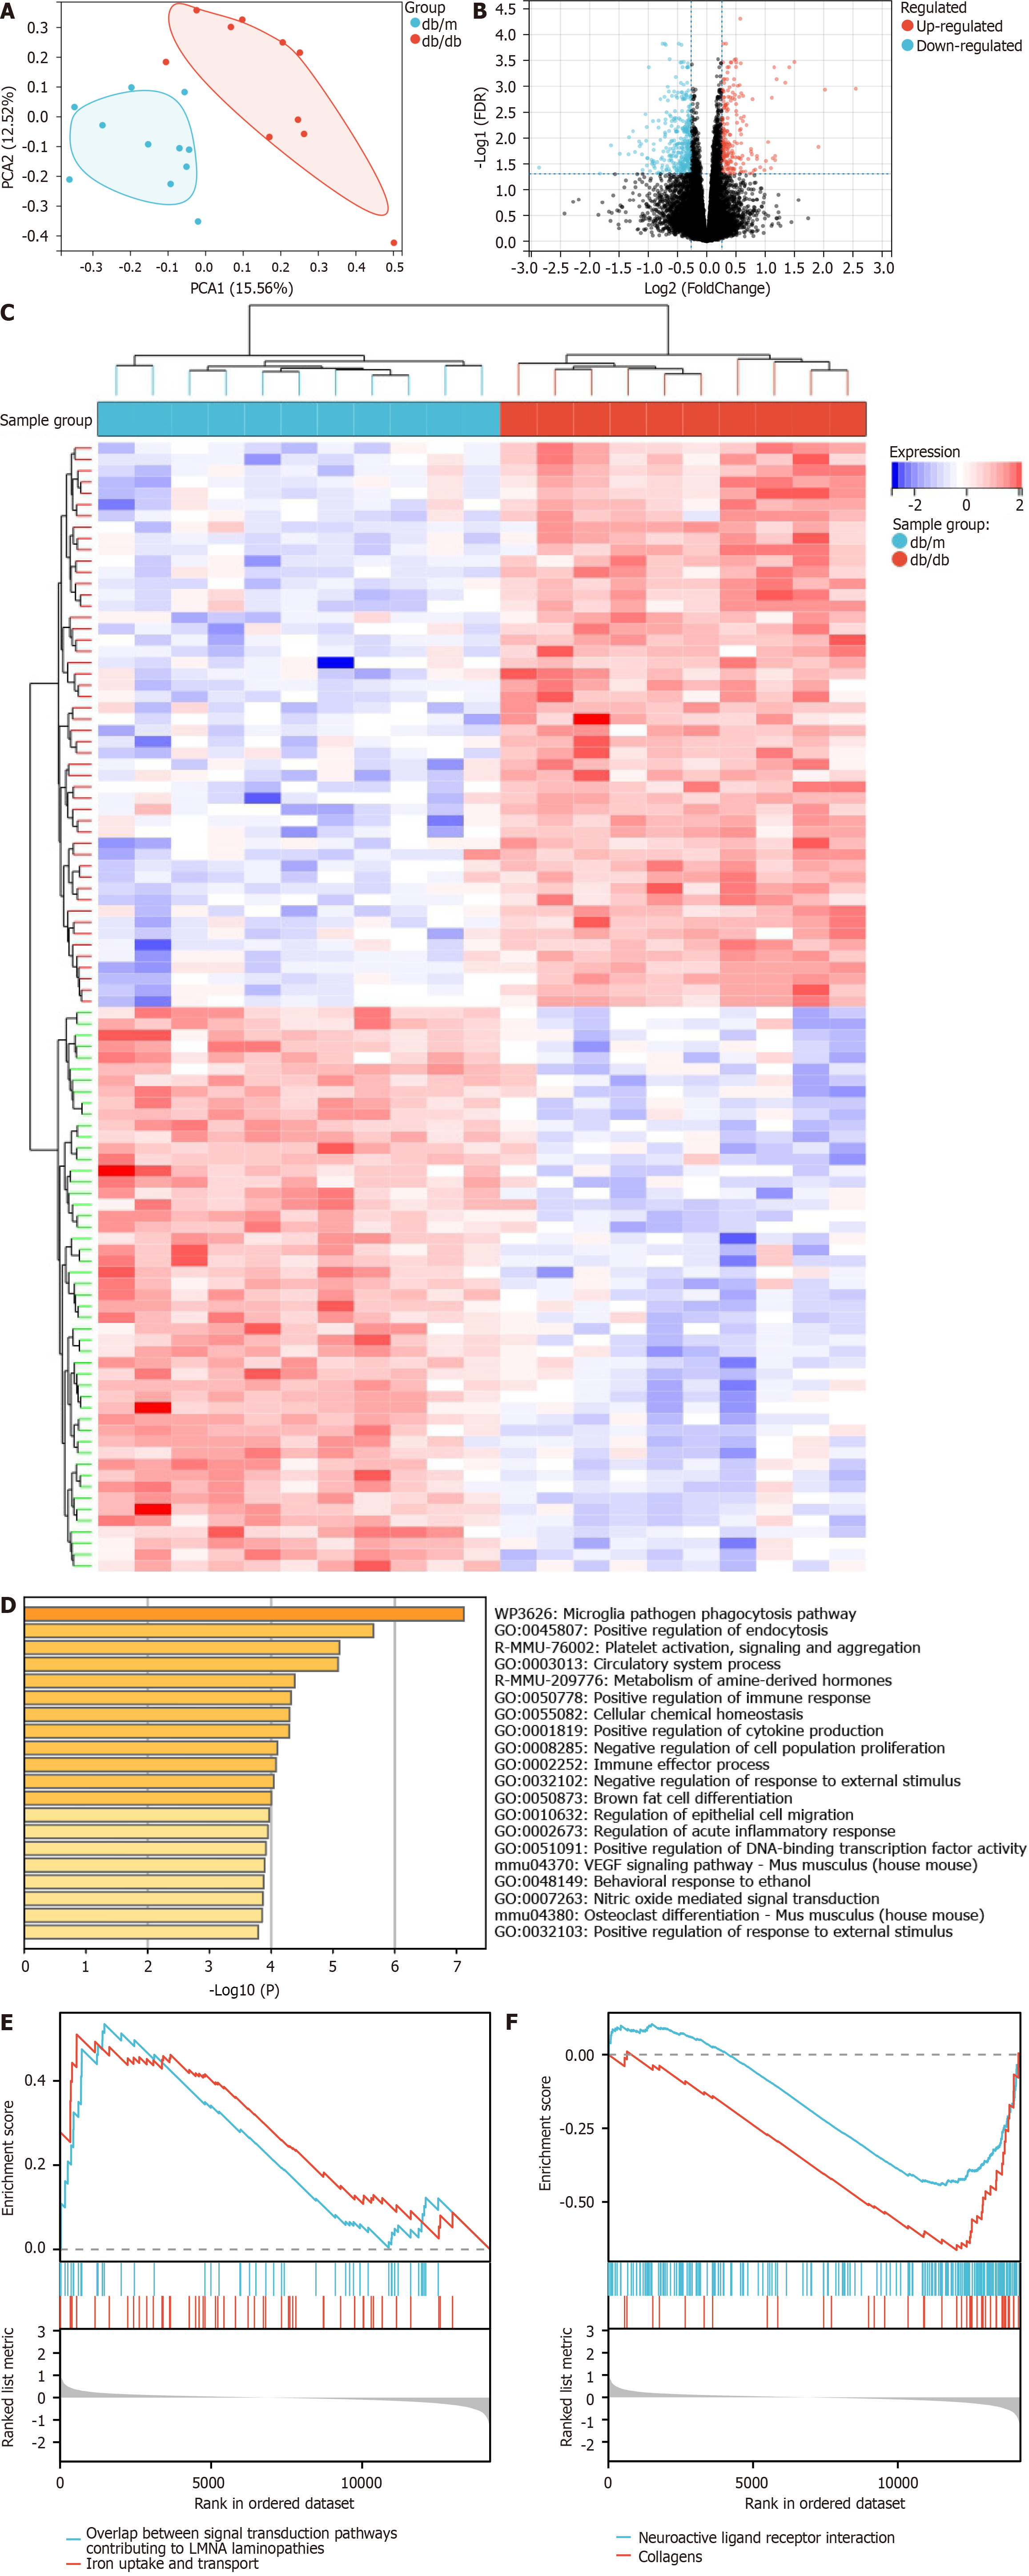
Figure 2 Differentially expressed genes in GSE125387 and functional enrichment analysis.
A: Principal component analysis shows that the db/db group and db/m group were distinctly separated; B: The volcano plot illustrates the distributions of differentially expressed genes (DEGs), with 214 genes showing upregulation (represented by red dots) and 362 genes showing downregulation (represented by blue dots). No significantly changed genes are marked as black dots; C: Heat map plot of the most significant DEGs; D: Analysis of functional enrichment for DEGs; E: Gene Set Enrichment Analysis (GSEA) between all the genes showing the up-regulated pathways; F: GSEA between all the genes showing the down-regulated pathways. PCA: Principal component analysis.
- Citation: Gao J, Zou Y, Lv XY, Chen L, Hou XG. Novel insights into immune-related genes associated with type 2 diabetes mellitus-related cognitive impairment. World J Diabetes 2024; 15(4): 735-757
- URL: https://www.wjgnet.com/1948-9358/full/v15/i4/735.htm
- DOI: https://dx.doi.org/10.4239/wjd.v15.i4.735


